
Daily Consumption Of Three Spreads
The graph below shows the daily consumption of three spreads per person from 1981 to 2007 in a country. Summarise the information by selecting and reporting the main features, and make comparisons where relevant.
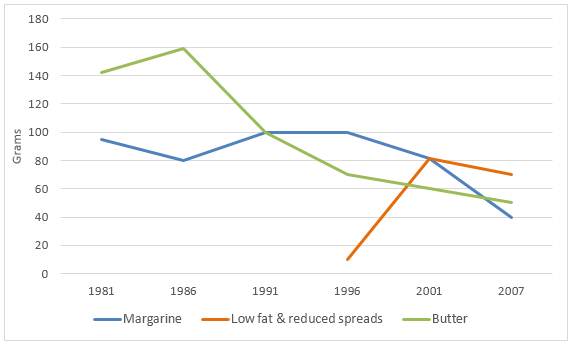
The line graph informs us of the data on how much the three spreads are daily consumed per person by residents in a country during the period 1981 to 2007.
Initially, the amount of butter spread at the first year of the period stood at 40 grams, then hit a peak at 160 grams six years later and considerably decreased to approximately 50 grams in 2007. On a contrary, margarine was the second most daily used spread with about 99 grams in 1981. Despite the drop of 80 grams in 1986, the figure kept rising at the same amount as butter in 1991 which was 100 grams. However, from 1991 to 1996, this number remained stable and then declined to 40 grams in 2007.
Looking at the chart in more details, it was not until 1996 that low fat and reduced spreads were consumed, but not as popular as the others, with the figure being around 10 grams in 1996. Similarly, there was also a drop in the use of this kind of spread in 2007 which was about 50 grams after a sharp growth.
Overall, butter was the most commonly used kind of spread generally while low fat and reduced ones were the least. Nevertheless, all three kinds of spreads experienced a downward trend in the end of the given period.
Get the Weekly English Kit 📬
New words, one handy idiom, and a 2-minute quiz — delivered to your inbox to keep your streak alive.
 Related Questions