
Could you review this essay for me ?
The graph below shows information on employment rates across 6 countries in 1995 and 2005.
Summarise the information by choosing and describe the main idea, and make comparisons where appropriate.
The bar chart compares the percentage of employed people from various countries around the world in 1995 and 2005.
Overall, the proportion of male employees in 2005 was the highest in all six countries while that of female employees was lowest. Another striking feature given from the bar chart is that the percentage of both genders increased from 1995 to 2005 in six related countries.
In 2005, the percentage of employment for male accounted for around 70% in Australia, the UK, New Zealand, the USA, increased to nearly 80% in Switzerland and that of in Iceland made up more than four-fifths while it accounted for 60% in six countries in 1995, apart from Iceland when it took up 70%. 28% of Australian employees and New Zealand were females in 1995 and went up to around 40% in 2005 while in the UK and the USA, 60% of employees were females and in 1995 were 50% and 45% respectively.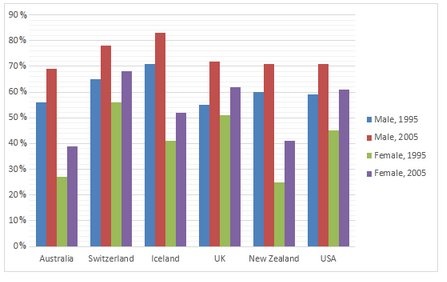
Top answer
An Quach The graph below shows information on employment rates Most of your phrases are poor or awkward English. You must use the correct name of the measurement, which is " employment rate ". Substitutions are not good.
- An Quach The graph below shows information on employment rates Most of your phrases are poor or awkward English.
- You must use the correct name of the measurement, which is " employment rate ".
- Substitutions are not good.
- This graph has a lot of information, so you must learn to be selective when reporting the data.
- Do not just copy the numbers from the graph to your essay.
Get the Weekly English Kit 📬
New words, one handy idiom, and a 2-minute quiz — delivered to your inbox to keep your streak alive.
An QuachThe graph below shows information on employment rates
Most of your phrases are poor or awkward English. You must use the correct name of the measurement, which is "employment rate". Substitutions are not good.
This graph has a lot of information, so you must learn to be selective when repor
 Related Questions