
Could you review my writing task 1?? Thank you so much.
The two pie charts compare the percentage of average spending in household in Japan and Malaysia in 2010. These are five categories of household: housing, transport, food, health care and other goods and services.
Overall, the lowest proportion of both two nations’s budget went to health care. In Japan, transport took the largest proportion of the total expenditure, and housing was in the third place. In Malaysia, the ordering was reversed.
In detail, housing and other goods and services made up half of the budget in Japan, with 21% and 29% respectively, whereas the proportion of those in Malaysia was over 50%, 34% for housing and 26% for other goods and services. In Japan, the cost of either health care or transport, with about 6% and 20%, was doubled the spending in those in Malaysia. Japanese spent more than Malaysian on three categories: transport, health care and other goods and services. The values for housing and transport was relatively equal in Japan, but the ratio was 3:1 in Malaysia, with 34% for housing and 10% for transport. 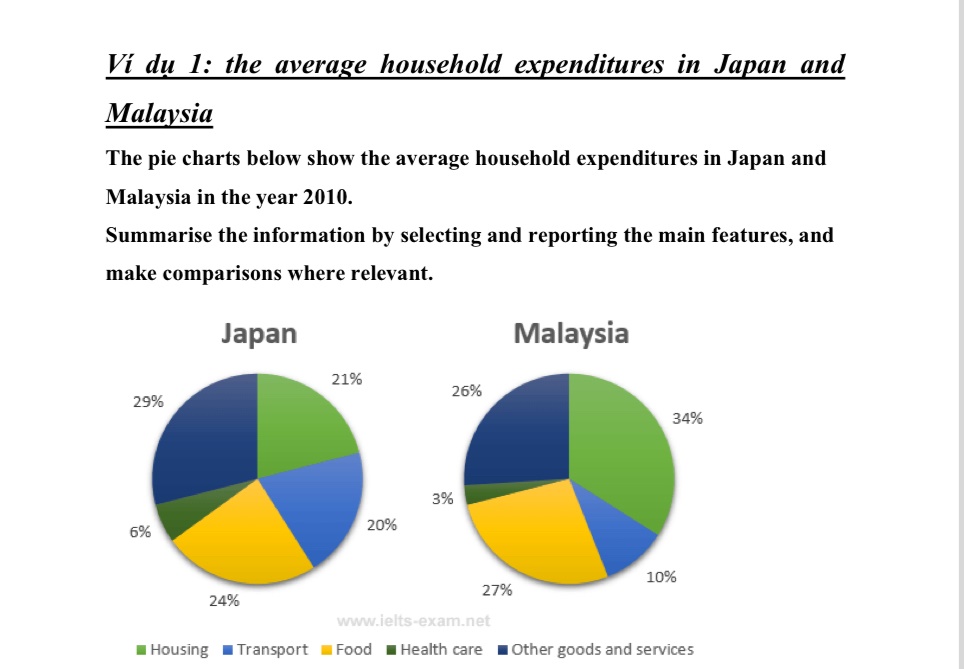
Get the Weekly English Kit 📬
New words, one handy idiom, and a 2-minute quiz — delivered to your inbox to keep your streak alive.
 Related Questions