
COULD YOU PLEASE REVIEW MY IELTS WRITING TASK 1? THANKS A LOT!
The graph below shows trends in UK meat and poultry consumption
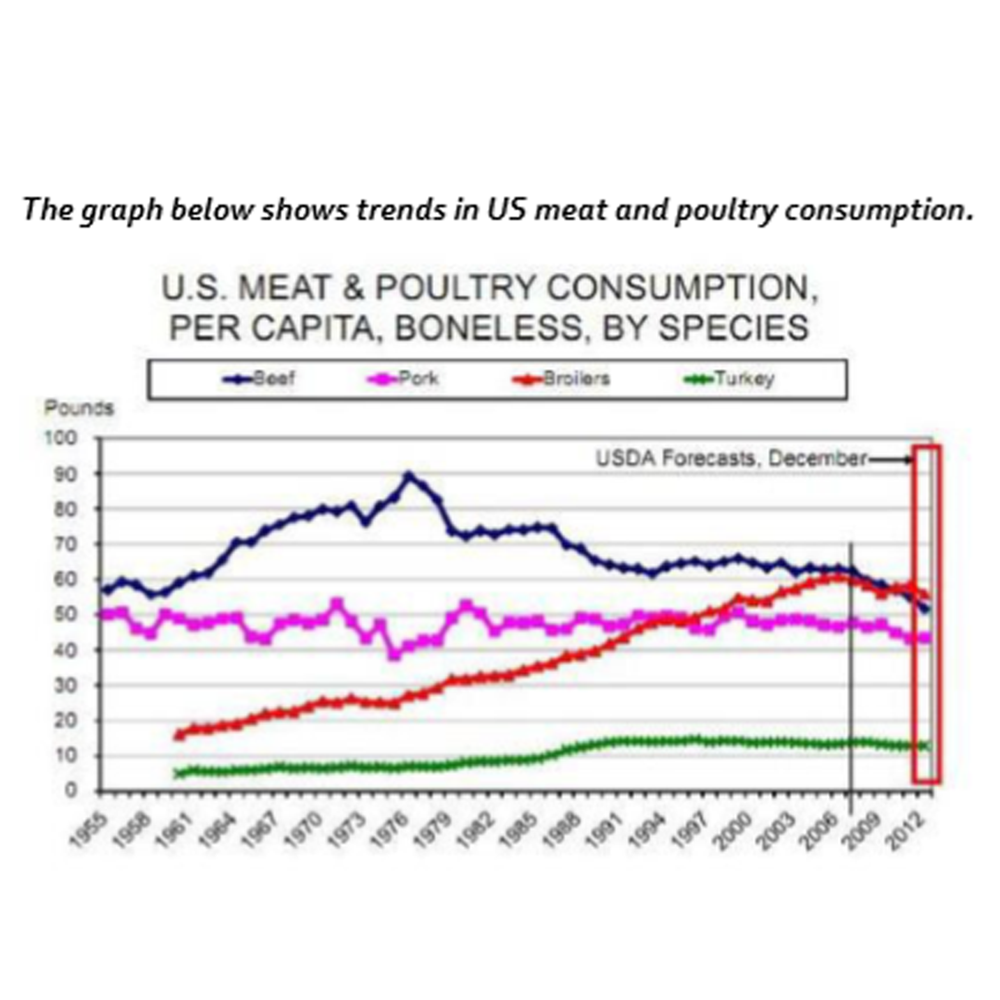
The line graph compares the consumption of 4 kinds of meat & poultry beef, pork, broilers, and turkey (by species) in the UK from 1955 to 2012.
Overall, the total amount of beef consumption was the highest throughout the period shown. In the early years, people in the UK did not tend to use poultry but poultry increased significantly while meat decreased between 1961 and 2012.
In detail, there were over 108 pounds of consumption in 1955; 54% of that was beef, and odds and ends were pork. In 1976, beef had a peak at 90 pounds while chicken went down by 10 pounds; broilers and turkey had also gone up from 0 to 30 and 9 respectively. From 1976 to 1997, chicken grew to the second at 50 pounds and pork consumption was around 5 pounds less than those.
Over the following 15 years, the total was 57 pounds more than in 1955. Broilers went up by approximately 8 pounds; turkey still remained unchanged; pork and beef dropped by 15 pounds.
Top answer
Please post essays, paragraphs, dialogues and other writing in the essay forum so a moderator does not have to move your post. Click on this link: Next, tap on the green button "write a new post"
- Please post essays, paragraphs, dialogues and other writing in the essay forum so a moderator does not have to move your post.
- Click on this link: Next, tap on the green button "write a new post"
Get the Weekly English Kit 📬
New words, one handy idiom, and a 2-minute quiz — delivered to your inbox to keep your streak alive.
You glanced at this figure and did not study it carefully. That is why you made some very silly mistakes that will lower your score.
If you would like a sample essay, you may ask for one.
The line graph compares the consumption of four kinds (Use words for small numbers that are not data values) of
 Related Questions