
Could you please review my IELTS writing task 1
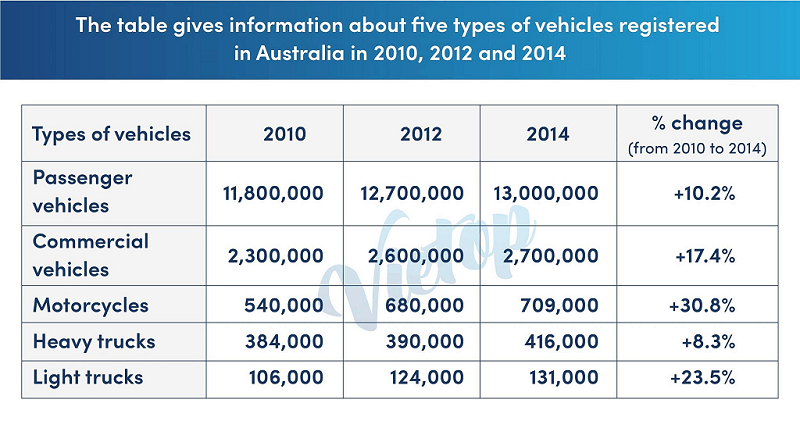
The given table provides data on the changed proportion of five different types of transport registered in Australia from 2010 to 2014.
In general, all of these categories have the upward tendency and the number of registered motorbikes experience the highest change.
From 2010, passenger vehicles have shown their dominant position with 11,800,000, while the others started with much lower index, commercial vehicles were 2,300,000 which was the second biggest. Motorcycles reached the middle place of these five which was 540,000 and heavy trucks, light trucks were respectively 384,000 and 106,000, two smallest categories.Until 2012 the ranking of these five types of registered vehicles in Australia still remained the same.
In 2014,there were about 13,000,000 public vehicles registered, which means it increased ten percent between 2010 and 2014. Commercial vehicles have risen more than seventeen percent to 2,700,000, the surprise is the number of registered motorbikes is the one that had undergone the most dramatic change which were 540,000 and climbed to around 710,000, meaning it increased approximately 31 percent. The quantity of heavy trucks experienced the tiniest change which was 8.3 percent and 416,000 trucks in 2014. Whereas the light trucks rose to 131,000 pieces which related to the figure for this category increased over 23 percent.
Get the Weekly English Kit 📬
New words, one handy idiom, and a 2-minute quiz — delivered to your inbox to keep your streak alive.
 Related Questions