
Could you please review ielts writing task 1 essay
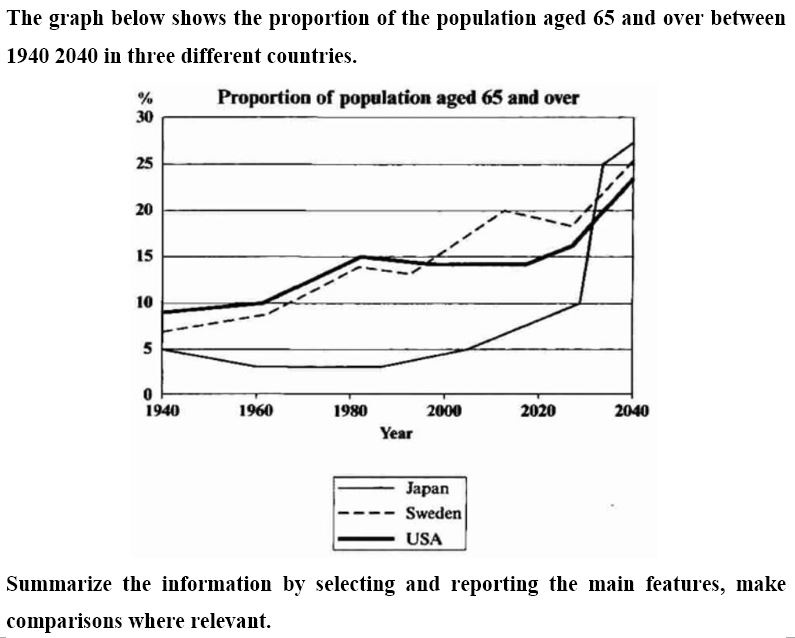
The line graph compares Japan, Sweden and USA in terms of the percentage of population aged 65 and over from 1940 to 2040.
Overall, the proportion of people aged 65 and over in Japan, Sweden and USA increased over a period of one hundred years. The figure for population aged 65 and over in Japan showed a significant growth between 2000 and 2040.
In 1940, USA was the country that had the highest percentage of population aged 65 and over, at nearly 10%, whereas that of Sweden and Japan were at around 7% and 5% respectively. Over the following fifty years, both USA and Sweden population showed an upward trend in the percentage of elderly people. By contrast, the proportion of old people in Japan declined gradually to about 8% in 1960 and remained the same from 1960 to 1990. After 2020, the elderly population of three countries continued to rise considerably. The experts predict that the percentage of old people in Japan will overtook that of both USA and Sweden in late 2030.
Top answer
The line graph compares Japan, Sweden and USA in terms of the percentage of population aged 65 and over from 1 940 to 2040. (2040 is in the future. ) over a period of one hundred years.
- The line graph compares Japan, Sweden and USA in terms of the percentage of population aged 65 and over from 1 940 to 2040.
- (2040 is in the future.
- ) over a period of one hundred years.
- ) a significant growth between 2000 and 2040.
- In 1940, USA was the country that had the highest percentage of population aged 65 and over, at nearly 10%, whereas that of Sweden and Japan were at around 7% and 5% respectively.
Get the Weekly English Kit 📬
New words, one handy idiom, and a 2-minute quiz — delivered to your inbox to keep your streak alive.
The line graph compares Japan, Sweden and USA in terms of the percentage of population aged 65 and over from 1940 to 2040.
(2040 is in the future. You have to consider that in your description.)
Overall, the proportion of people aged 65 and over in Japan, Sweden and USA increased
 Related Questions