
Could you please review ielts writing task 1 essay
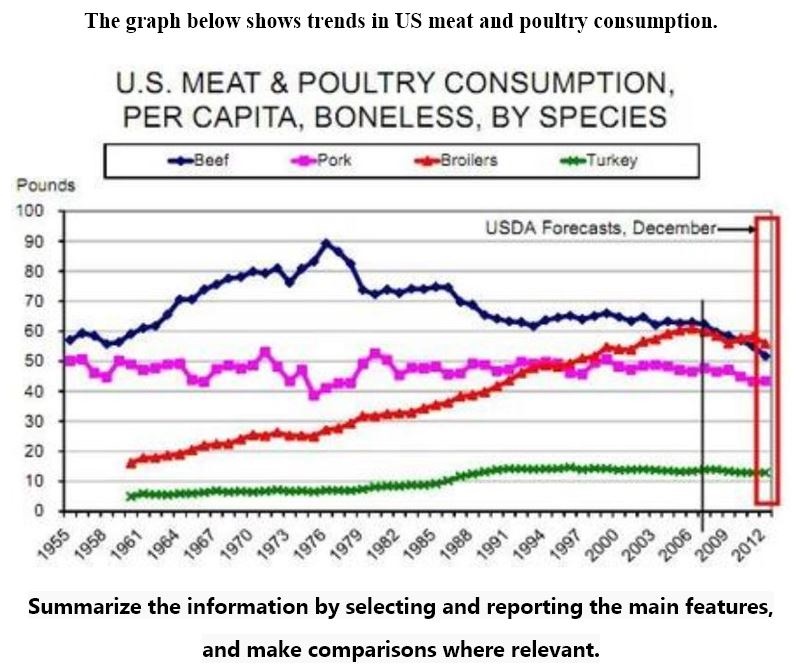
The line graph compares consumption of four different livestock commodities in US from 1955 to 2012. The four livestock commodities are beef, pork, broilers and turkey.
Overall, the consumption of beef was considerably higher than that of other livestock commodities. On the other hand, broilers consumption was the lowest over a period of 57 years.
Between 1955 and 1976, there was an upward trend in the consumption of both beef and broilers. The amount of beef consumed by individual peaked at nearly 90 pounds, whereas that of broiler rose to approximately 30 pounds. However, the intake of turkey remained relatively the same, at around 10 pounds per capita, while pork consumption fluctuated between roughly 50 and 40 pounds per capita. In 2009, the amount of broilers consumption was nearly double the figures in 1976. There was a sharp drop in beef consumption from 1976 to 2009. The UADA Forecasts predict that the consumption of broilers will overtake that of beef in 2012.
Top answer
The line graph compares the consumption of four different meats livestock (wrong word) commodities (wrong word) in the US from 1955 to 2012. ) The four meats livestock commodities are beef, pork, chicken broilers and turkey. ) Overall, the consumption of beef was considerably higher than the others.
- The line graph compares the consumption of four different meats livestock (wrong word) commodities (wrong word) in the US from 1955 to 2012.
- ) The four meats livestock commodities are beef, pork, chicken broilers and turkey.
- ) Overall, the consumption of beef was considerably higher than the others.
- ) that of other livestock commodities .
- On the other hand, broilers consumption was the lowest over a period of 57 years.
Get the Weekly English Kit 📬
New words, one handy idiom, and a 2-minute quiz — delivered to your inbox to keep your streak alive.
The line graph compares the consumption of four different meats livestock (wrong word) commodities (wrong word)in the US from 1955 to 2
 Related Questions