
Could you please review ielts writing task 1 essay
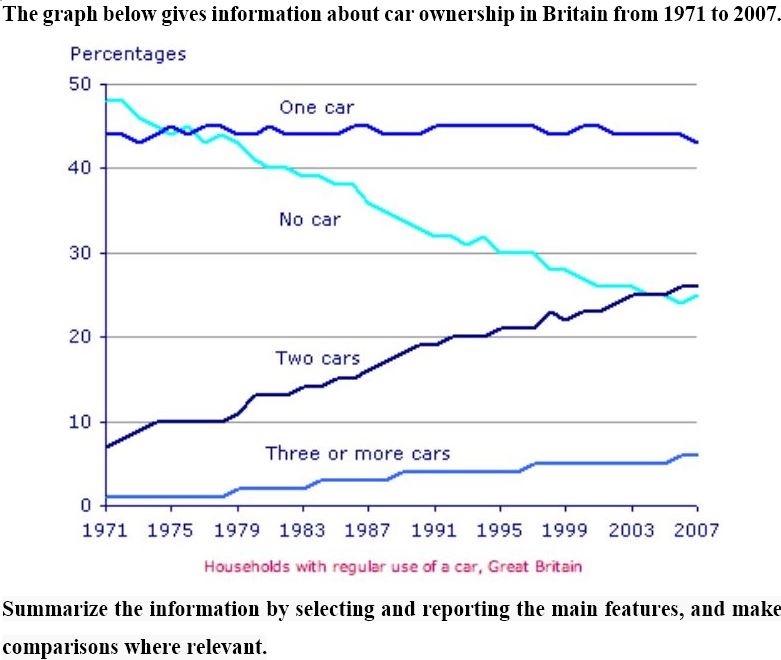
The line graph compares households in terms of car ownership in Britain between 1971 to 2007.
Overall, the percentage of household owning one car remained relatively the same over the period shown. However, both proportion of households owning two cars and households owning three or more cars showed a gradual increase, whereas that of no car households declined significantly.
In 1971, the percentage of households with no car was the highest, at roughly 50%. On the other hand, that of households with two cars and households with three or more cars were at about 7% and 2% respectively. Over the following 8 years, the percentage of household with two cars rose by 3%. With regard to one car households, it fluctuated between 44% and 42%. From 1979 to 2007, there was a sharp drop in the percentage of no car households showed. It decreased drastically to around 25%. By contrast, the proportion of two cars households showed a considerably increase, by nearly 20%. Similarly, there was also an upward trend in that of three or more cars households, while one car households remained relatively constant.
Top answer
Please read my advice for Task 1 essays. IELTS TASK 1: Hints, Tips And Advice Vocabulary Words For Task 1: Reference Post
- Please read my advice for Task 1 essays.
- IELTS TASK 1: Hints, Tips And Advice Vocabulary Words For Task 1: Reference Post
Get the Weekly English Kit 📬
New words, one handy idiom, and a 2-minute quiz — delivered to your inbox to keep your streak alive.
The line graph compares households in terms of car ownership in Britain between 1971 to 2007. How many curves are on the graph? What are they? You need to tell the reader so your essay will have coherence and cohesion.)
Overall, the percentage of household (wrong form) owning one car remained relatively the same over the perio
 Related Questions