
Could you please review ielts writing task 1 essay
Summarise the information by selecting and reporting the main features, and make comparisons where relevant.
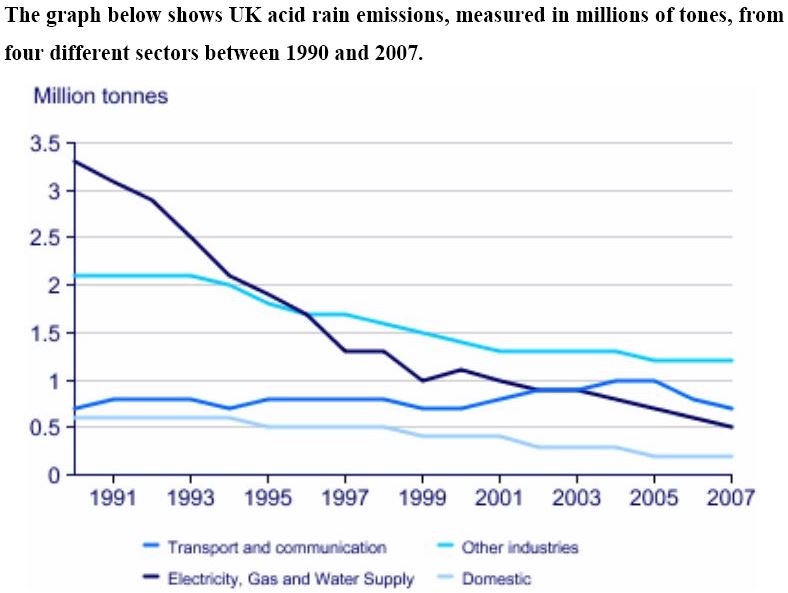
The line graph compares four different sectors in terms of the amount of acid rain emissions in UK from 1991 to 2007.
Overall, there was a sharp drop in the amount of acid rain emitted by electricity, gas and water supply. On the other hand, acid rain emission from domestic was the lowest in comparison with other sectors.
In 1991, acid rain emission from electricity, gas and water supply was the highest, at around 3.25 tonnes, while that of domestic was the lowest, at roughly 0.5 tonnes. Over the following 3 years, there was a sharp drop in the acid rain emission of electricity, gas and water supply. It declined to nearly 2 tonnes. By contrast, three other sectors remained almost the same. In 1997, the amount of acid rain discharged by other industries overtook that of electricity, gas and water supply. It was around 1.75 tonnes, while acid rain emission from electricity, gas and water supply was under 1.5 tonnes, at approximately 1.25 tonnes. Between 1997 and 2007, transport and communication was the only sector saw a moderate increase, whereas other three sectors remain relatively constant.
Top answer
The line graph compares four different sectors in terms of the amount of acid rain emissions , given in millions of tonnes, in the UK from 1991 to 2007. (Incomplete. ) Overall, there was a sharp drop in the amount of acid rain emitted by electricity, gas and water supply.
- The line graph compares four different sectors in terms of the amount of acid rain emissions , given in millions of tonnes, in the UK from 1991 to 2007.
- (Incomplete.
- ) Overall, there was a sharp drop in the amount of acid rain emitted by electricity, gas and water supply.
- (Are they three of the four sectors?
- The reader is confused.
Get the Weekly English Kit 📬
New words, one handy idiom, and a 2-minute quiz — delivered to your inbox to keep your streak alive.
The line graph compares four different sectors in terms of the amount of acid rain emissions, given in millions of tonnes, in the UK from 1991 to 2007. (Incomplete. What are the four sectors?)
Overall, there was a sharp drop in the amount of acid rain emitted by electricity, gas and water sup
 Related Questions