
Could you please check my writing task 1 (IELTS) and can you give me a feedback on my writing skill?
The line graph demonstrates the amount of acid rain emissions in the UK from 1990 to 2007.
Overall, there was a downward trend in the amount of acid rain emissions in Britain. Whereas the figure for electricity, gas and water supply sector experienced a significant drop, the amount of acid rain triggered by transport and education fluctuated and remained the in the last year.
In 1990, the domestic sector was responsible for roughly 0.5 million tones of acid rain accounting for a quarter of the figure for other industries. The amount of acid rain emissions from domestic sector and other industries both decreased between 1990 and 2007, with the figure for other industries sector dropped at a more significant rate. In 2007, there were approximately 1.25 million tones of acid rain in other industries sector, which were about 1 million tones more than that of the domestic sector.
Between 1990 and 1997, whereas the amount of acid rain emissions resulting from electricity, gas and water supply deceased dramatically, the figure for transport and communication slightly fluctuated and remained its stability at roughly 0.75million tones most of the time. From 2003 onwards, the amount of aid rain emissions from electricity, gas and water supply dropped to 0.5 million tones, which was slightly lower than that of transport and communication.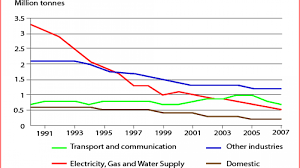
Top answer
Please read my advice for Task 1 essays. IELTS TASK 1: Hints, Tips And Advice Vocabulary Words For Task 1: Reference Post The line graph demonstrates (Poor word choice. Read my advice) the amount of acid rain emissions in the UK from 1990 to 2007.
- Please read my advice for Task 1 essays.
- IELTS TASK 1: Hints, Tips And Advice Vocabulary Words For Task 1: Reference Post The line graph demonstrates (Poor word choice.
- Read my advice) the amount of acid rain emissions in the UK from 1990 to 2007.
- ( That means there is ONE curve on the graph plotting the emissions.
- Your essay will not have good coherence because you do not mention FOUR curves in the basic description of the graph.
Get the Weekly English Kit 📬
New words, one handy idiom, and a 2-minute quiz — delivered to your inbox to keep your streak alive.
 Related Questions