
Could you please check my essay?
Answer:
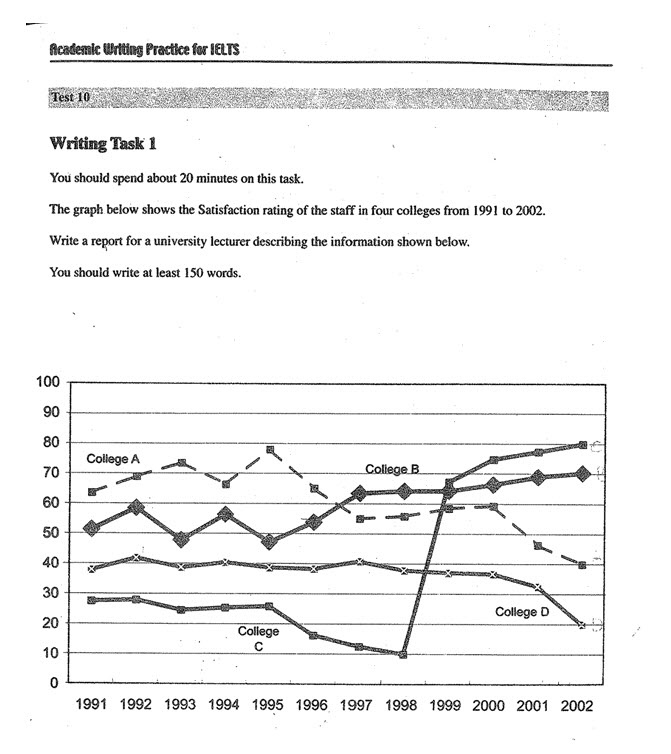
The graph shows the satisfaction rating of the staff in percentage terms for four colleges, during the eleven-year period, from 1991 to 2002.
Generally, just only college B and college C had seen some improvements in their satisfaction rates, while the other two, college A and college C, had lost quite much appreciation from people about their staff.
Before reaching the high ends, the rates in both college B and college C were volatile, especially from 1992 to 1995. For the next three years, the opposite pattern had been seen between the two, with a gradual rise up to approximately 65% for college B and a gradual falling down to 10% for the other. There was, however, a marked improvement in the satisfaction rate for college C to nearly 70% in 1999, followed by a steady rise during the last 3 years and it ended up at a very impressive rate, 80%. Meanwhile, college C remained its rising till the end of the eleven-year period, with the final percentage of just 10% less than college B.
The two colleges left, A and B, on the contrary, both ended the period with approximately 20% lower than the initial year’s level. However, before suffering from a sharp decline in the last year, college D had very stable rates which were always around 30-40% for continuous 10 years, while college A experienced a much more erratic pattern with more downs than ups, leading to a very poor rate in the end, at 40%.
Top answer
) graph shows the satisfaction rating of the staff in percentage terms for four colleges, during the eleven-year period, (no comma) from 1991 to 2002. ) some improvements in their satisfaction rates, while the other two, college A and college C, had lost quite much appreciation from people about their staff. (unnatural This sounds like your opinion or conclusion.
- ) graph shows the satisfaction rating of the staff in percentage terms for four colleges, during the eleven-year period, (no comma) from 1991 to 2002.
- ) some improvements in their satisfaction rates, while the other two, college A and college C, had lost quite much appreciation from people about their staff.
- (unnatural This sounds like your opinion or conclusion.
- Just describe the data.
- ) the satisfaction rat ing in both college B and college C were volatile, especially from 1992 to 1995.
Get the Weekly English Kit 📬
New words, one handy idiom, and a 2-minute quiz — delivered to your inbox to keep your streak alive.
Please read my advice for Task 1 essays: IELTS TASK 1: Hints, Tips And Advice
The (What kind of graph?) graph shows the satisfaction rating of the staff in percentage terms for four colleges, during the eleven-year period, (no comma) from 1991 to 2002.
Gene
 Related Questions