
Could you help me with my writing Ielts task 1, please? Thank you a lot.
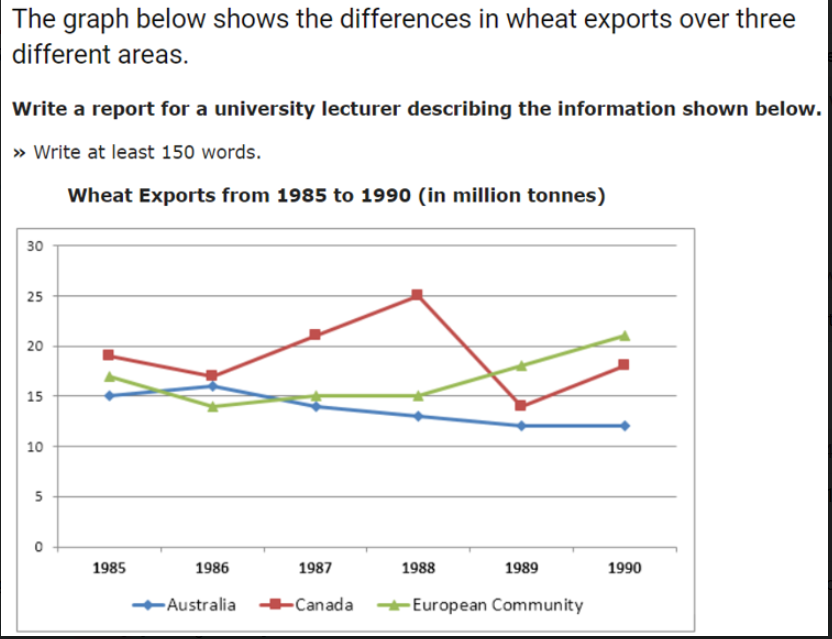
The line graph compares the three regions in terms of wheat exports between 1985 and 1990.
Overall, there was a similar downward trend in the number of wheat exports of Australia and Canada, whereas European Community experienced a contrasting movement over the given period.
As the graph shows, Australia’s wheat exports started at 15 million tonnes in 1985, which was the lowest at the beginning. This was followed by a slight increase to about 16 million tonnes in 1986 and then it went down steadily to around 12 million tonnes at the end of the given period. Between 1985 and 1986, the number of European Community’s wheat exports decreased significantly by 3 million tonnes approximately, but then it boomed to about 21 million tonnes in 1990.
In 1985, nearly 20 million tonnes of wheat were exported by Canada, this number was the highest at the start point. Then, the exports reached a peak at 25 million tonnes in 1988 and declined sharply to under 15 million tonnes in 1989. But at the end of the given period, this figure went up to 17 million tonnes approximately.
Top answer
Please read my advice for Task 1 essays: IELTS TASK 1: Hints, Tips And Advice Vocabulary Words For Task 1: Reference Post
- Please read my advice for Task 1 essays: IELTS TASK 1: Hints, Tips And Advice Vocabulary Words For Task 1: Reference Post
Get the Weekly English Kit 📬
New words, one handy idiom, and a 2-minute quiz — delivered to your inbox to keep your streak alive.
The line graph compares the three regions in terms of their wheat exports between 1985 and 1990. (What are the three regions?)
Overall, there was a similar downward trend in the number (wrong word. "Exports" is non-count. "Number" does not work with non-count items.)
The line graph compares the wheat exports (in millions of tonnes (MT)) of three world regions, the European Community (EU), Canada and Australia between 1985 and 1990.
Overall the total amount did not vary significantly over this period, but the proportions contributed by the individual regions did. Canada was the leading exporter from 1985 through mid-1988, and was surpassed by the EU a
 Related Questions