
Could you help me with my writing Ielts task 1, please? Thank you a lot.
The graphs below show the cinema attendance in Australia and the average cinema visits by different age groups from 1996 to 2000. Summarize the information by selecting and reporting the main features and make comparisons where relevant.
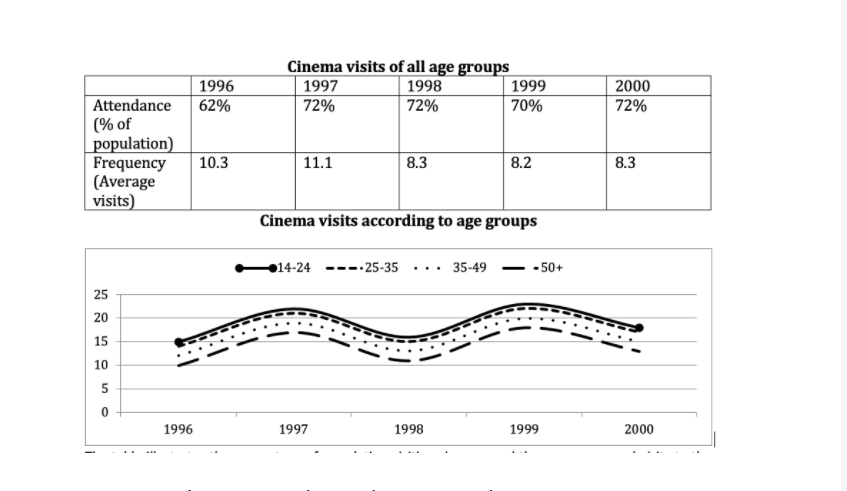
The table shows the percentage of the population watching movies at cinemas and their average visits from 1996 to 2000, whereas the line graph compares the annual cinema visits of four different age groups in Australia.
Overall, there was an increase in the number of people attending the cinemas and a decrease in the average annual visits throughout the period. All age group follows a similar trend with the 14 - 24 years old being the fondest of cinemas.
At the start of the period, 62% came to the cinema. This figure soon went up to 72% in 1998 but after that, it remained stable till 2000. In 1996, the average yearly visits started at 10.3% but increased slightly to 11.1% in 1998. In the next 3 years, this percentage reduced and ended up with 8.3% at the end of the period.
As for the line chart, the number of visits by all age groups in 1996 was between 10 to 15 times a year, with the group of young people at the top. In the following year, 4 groups had a similar fluctuate trend from 10 to 25 times throughout the 4-year period.
Top answer
Please read my advice for Task 1 essays. Please be careful in choosing the source for your practice tests. Do you understand why you should completely ignore this one?
- Please read my advice for Task 1 essays.
- Please be careful in choosing the source for your practice tests.
- Do you understand why you should completely ignore this one?
- IELTS TASK 1: Hints, Tips And Advice Vocabulary Words For Task 1: Reference Post
Get the Weekly English Kit 📬
New words, one handy idiom, and a 2-minute quiz — delivered to your inbox to keep your streak alive.
Please read my advice for Task 1 essays.
Please be careful in choosing the source for your practice tests.
Do you understand why you should completely ignore this one?
The table shows the percentage of the Australian population who went to a watching movies at cinema and their average number of visits from 1996 to 2000. whereas Th
The given table chart illustrates about the porportion of viewers and their average annual visit to the cinema.While, the line graph compares about the trend of sightseers according to different age group in Australia from 1996 to 2000.
Overall, It can be seen that the percentage of people watching cinema had considerably increased.Whereas, the porportion of average annual visit had decr
 Related Questions