
Could you help me correct my writing task 1. Thank you.
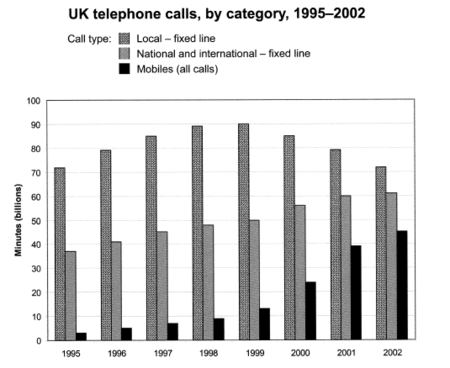
The chart below shows the total number of minutes (in billions) of telephone calls in the UK, divided into three categories, from 1995-2002.
Answer
The bar char compares the amount of time people in the UK spent on three types of hone call between 1995 and 2002.
Overall, the telephone calls that used local and fixed line were the most popular types among overall usage. The lowest category was mobiles call, but this category had the significant rise throughout the period.
In 1995, people lived in the UK spent 70 billion minutes on local calls, and about half the amount of time was 36 billion minutes for national and international calls, on contrast, mobile phones were only be used for 4 billion minutes. Over the following four years, all type of telephone calls increased generally.
In 1999, the amount of time the UK people make via local calls reached the peak at 90 billion minutes. The figure in this category declined, but the figure in the other two types of phone call continued. In the end of the period, national and international call reached 55 billion minutes on the mobiles call in the UK reached 46 billion minutes, while the local calls time decreased and reached 70 billion minutes.
Top answer
Okay, here are my corrections, comments, and suggestions: The bar char t compares the amount of time people in the UK spent on three types of p hone call s between 1995 and 2002. Overall, the telephone calls that used local and fixed line s for local and national/international calls were the most popular types among overall usage. The lowest category was mobile s call s , but this category had the a significant rise throughout the period.
- Okay, here are my corrections, comments, and suggestions: The bar char t compares the amount of time people in the UK spent on three types of p hone call s between 1995 and 2002.
- Overall, the telephone calls that used local and fixed line s for local and national/international calls were the most popular types among overall usage.
- The lowest category was mobile s call s , but this category had the a significant rise throughout the period.
- ] In 1995, people who lived in the UK spent 70 billion minutes on local calls, and about half the that amount of time , wa s 36 billion minutes , for national and international calls .
- ,on In contrast, mobile phones were only be used for 4 billion minutes.
Get the Weekly English Kit 📬
New words, one handy idiom, and a 2-minute quiz — delivered to your inbox to keep your streak alive.
Okay, here are my corrections, comments, and suggestions:
The bar chart compares the amount of time people in the UK spent on three types of phone calls between 1995 and 2002.
Overall, the telephone calls that used local and fixed lines for local and national/international calls were the most popular types among overall usage. Th
 Related Questions