
Could you check and score my task 1 ielts essay. Thanks
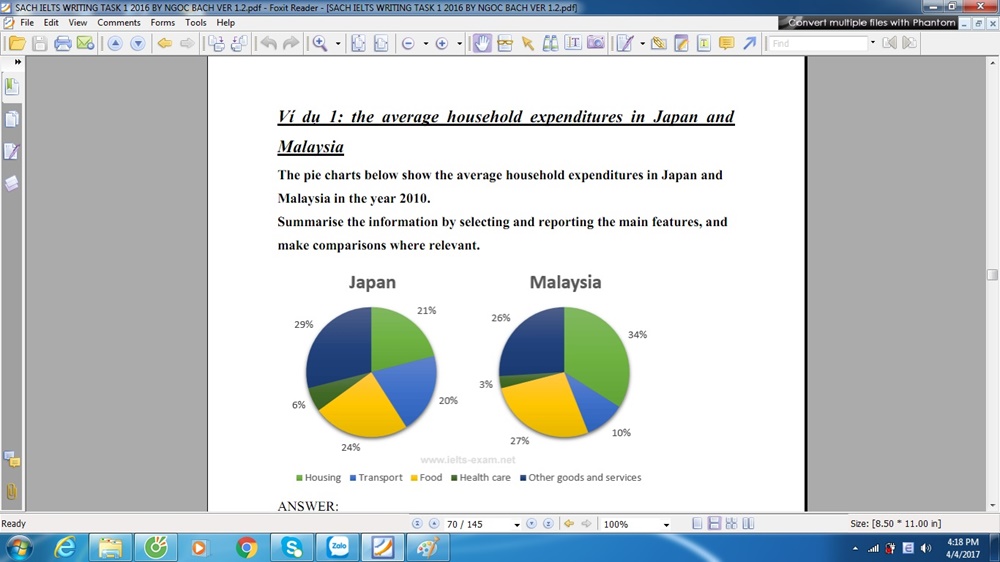
The pie charts compare spending in Japan and Malaysia in terms of various categories in 2010.
Overall, spending on housing and food and others goods and services accounted for the largest proportion of expenses in both Japan and Malaysia. In addition, Japan expenditures on transport and health care were double compared with Malaysia.
34% of expenses in Malaysia, which accounted for the largest part, was for housing while the figure for Japan was 21%. In terms of food, the figure for Malaysia was slightly higher more than that for Japan, at 27% and 24% respectively. However, the proportion of others goods and services in the expenditure of Japan (29%) was 3% more than that in expenses of inhabitants in Malaysia (26%).
The percentage of spending on health care was lowest in both nations, at 6% (Japan) and 3% ( Malaysia). In Japan, 20% of household spending went on transport. This figure was double that shown for Malaysia.
Top answer
could anyone check my essay, please! Thanks
- could anyone check my essay, please!
- Thanks
Get the Weekly English Kit 📬
New words, one handy idiom, and a 2-minute quiz — delivered to your inbox to keep your streak alive.
 Related Questions