
Could somebody review my IELTS Task 1 essay
My writing:
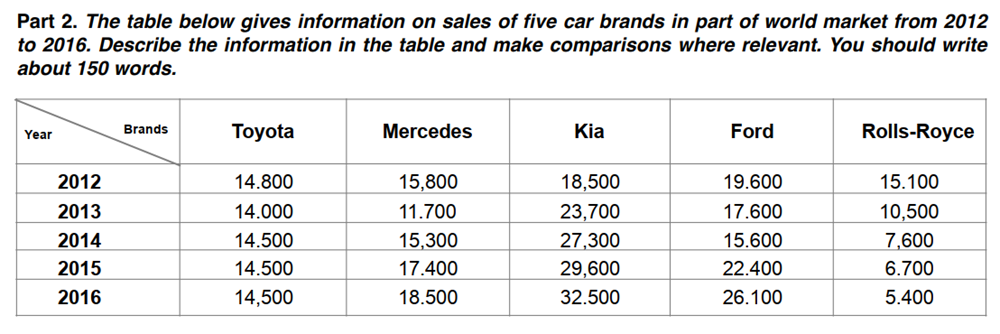
The table delineates profits made by five car companies, namely Toyota, Mercedes, Kia, Ford, and Rolls-Royce. The survey covered a five-year period, from 2012 to 2016.
As illustrated in the graph, Ford starts off with the highest position of 19.600. Although in the next two years, its figure dropped down to 15.600, Ford's sales regained its upward streak, jumped back to 22.400 in 2015 and finally 26.100 in 2016. Mercedes' figure had somewhat similar trend, falling from 15.800 in 2012 to 11.700 in 2013 notwithstanding, it recovered back to 15.300 the following year and steadily rocketed to 18.500 in the last year.
Fluctuating as these two aforementioned figures are, Kia's and Rolls-Royce's sales had the same steady but opposite trends. While Kia's number rose gradually from 18.500 in 2012 to 32.500 in 2016, that of Rolls-Royce declined dramatically from initially 15.100 to a low of 5.400. Besides, no sooner had Toyota's figure recovered from 14.00 in 2013 to 14.500 the next year did it level of until the end of the period surveyed.
Overall, although there is elements of oscillation in the sales of Ford and Mecerdes, the trend of the rest categories are obviously more evident, steady change or immutable one.
Please be hard-hitting while pointing out my mistakes.
Top answer
The table delineates (wrong word - use lists, provides or shows ) profits (wrong word) made by five car companies, namely Toyota, Mercedes, Kia, Ford, and Rolls-Royce in each year between 2012 and 2016 . The survey (wrong word - no survey is mentioned. ) covered a five-year period, from 2012 to 2016 .
- The table delineates (wrong word - use lists, provides or shows ) profits (wrong word) made by five car companies, namely Toyota, Mercedes, Kia, Ford, and Rolls-Royce in each year between 2012 and 2016 .
- The survey (wrong word - no survey is mentioned.
- ) covered a five-year period, from 2012 to 2016 .
- As illustrated in the graph, (wrong word.
- A table is not a graph.
Get the Weekly English Kit 📬
New words, one handy idiom, and a 2-minute quiz — delivered to your inbox to keep your streak alive.
The table delineates (wrong word - use lists, provides or shows ) profits (wrong word) made by five car companies, namely Toyota, Mercedes, Kia, Ford, and Rolls-Royce in each year between 2012 and 2016. The
 Related Questions