
Correct my writing plz :'(
My essay:
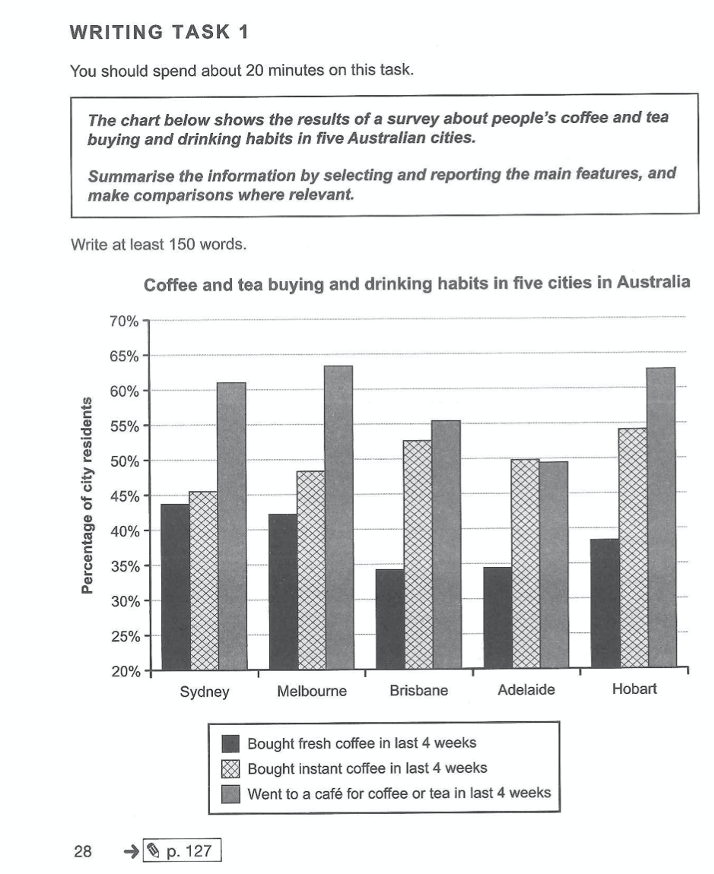
The bar graph compares the proportions of people’s habits on buying and drinking coffee and tea, which were investigated in five cities in Australia including Sydney, Melbourne, Brisbane, Adelaide, and Hobart in the last four weeks.
Overall, it is clear that the data of those who went to a cafe for coffee or tea in the last 28 days in all cities held the highest percentages, with the exception of that in Adelaide. Moreover, soluble coffee sales registered the second most percentages whilst fresh coffee purchases were the lowest in all cities.
Going to a cafe for coffee or tea, which is considered the most popular choice amongst all cities, recorded the highest proportion in Melbourne, at slightly lower than 65%, followed closely by Hobart and Sydney (just over 60% each). Regarding the figure of instant coffee sales, the highest percentage was reported in Hobart, at nearly 55%. Interestingly, Adelaide was the only city whose date of this category was recorded to be mildly higher than having tea and coffee at a cafe( more than approximately 2%).
Consuming fresh coffee in the given time was the least popular amongst other choices, with about 44% in Sydney, followed by Melbourne, at only fewer than 2%. However, the figures of Brisbane and Adelaide registered the lowest level in this criteria, with only around 34%.
Top answer
Please post essays, paragraphs, dialogues and other writing in the essay forum so a moderator does not have to move your post. Click on this link: Next, tap on the green button "write a new post"
- Please post essays, paragraphs, dialogues and other writing in the essay forum so a moderator does not have to move your post.
- Click on this link: Next, tap on the green button "write a new post"
Get the Weekly English Kit 📬
New words, one handy idiom, and a 2-minute quiz — delivered to your inbox to keep your streak alive.
The bar graph compares the proportions of people’s habits (Incorrect. What is half of a habit?) on buying and drinking coffee and tea, which were investigated (Not good) in five cities in Australia including (Wrong word. "Including" means
 Related Questions