
Check my grammar, structure and band. thank you
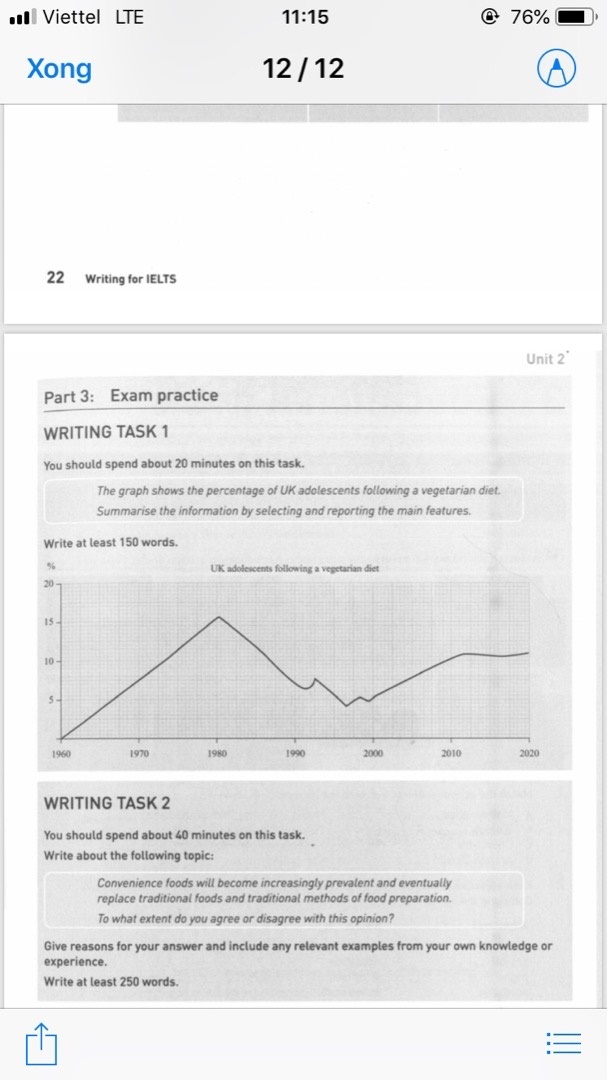
The line chart illustrates the quantity of UK teenagers adopting vegetarian regime from 1960 to 2020
As an overview statement, there was a fluctuated trend although most span of time, the trend was upward
From 1960 to 1980, the adolescences who pursue vegetarianism shot up and peaked approximately 15%. However, the trend bottomed out in the next 20 years and hit a trough in 1996 at 4%. Despite the growth up slightly of the rate in 1998 ,it decreased in 2000 at 5%, which was the second lowest, below the statistic in 1996 .
Thereafter, in the period of 2000 to 2020, there was a recovery of the vegetarian who was the youth. In 2010, the figure surged by 5% and equal two-third compared to number in 1990. Eventually, in 2020, it ended up with steadiness, virtually the same as the number in 2010
Top answer
The line chart illustrates the changes in the quantity [ 1] percentage of UK teenagers adopting a vegetarian regime diet from 1960 to 202 0. As an overview statement, Overall, there was a fluctuated trend although most span of time, the trend was upward , despite a dip in the middle. ------------------------------ [ 1]: We do not use “quantity” when referring to people.
- The line chart illustrates the changes in the quantity [ 1] percentage of UK teenagers adopting a vegetarian regime diet from 1960 to 202 0.
- As an overview statement, Overall, there was a fluctuated trend although most span of time, the trend was upward , despite a dip in the middle.
- ------------------------------ [ 1]: We do not use “quantity” when referring to people.
- The rest of your text is not well phrased.
- Here are some starters you might want to use.
Get the Weekly English Kit 📬
New words, one handy idiom, and a 2-minute quiz — delivered to your inbox to keep your streak alive.
The line chart illustrates the changes in the quantity [ 1] percentage of UK teenagers adopting a vegetarian regime diet from 1960 to 2020.
You double-posted this essay. Please do not do that.
https://www.englishforums.com/English/CanGiveAdviceThankYou/bpwrcq/post.htm
 Related Questions