
Check IELTS writing task 1
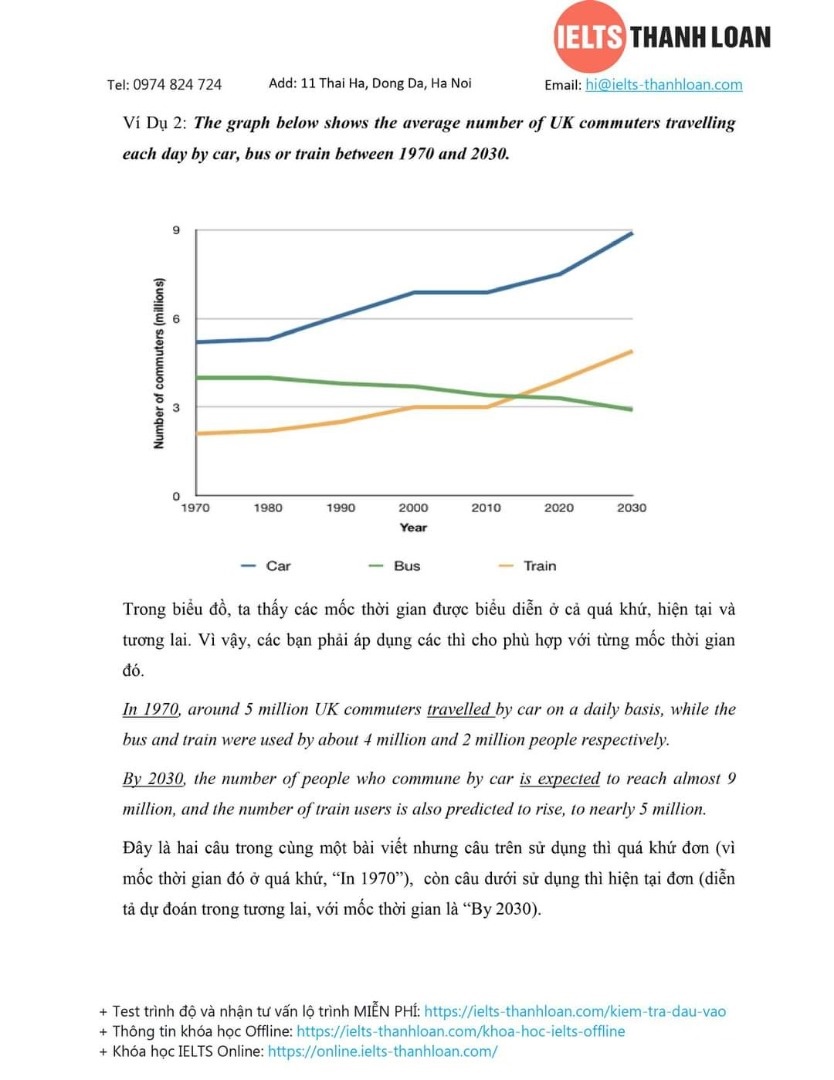
The line graph illustrates the average number of commuters travelling by 3 difference transports car, bus, train in UK from 1970 to 2030.
Overall, there is a fluctuated number of 3 vehicles. People travelling by car and train are in terms of increase, car's commuters number is higher than that of train in whole historical. Bus's commuters line can be seen there is a gradual downward trend.
In the 1970-2020 period, the average number of people who travel by train rised dramatically to approximately 4 millions. That of car had a same changes, it increased rapidly from below 6 millions to about 8 millions people. By constract, the bus line fell steadily to nearly 3 millions in 2020.
Throughout the reminder of the 2020-2030 year- period, the number of commuters travelling by train is respected to grow quickly in 10 years later. Beside, the number of people travelling by car will vary more significantly than that of train, it will reach a peak at 9 millions. Over the same period, the number of bus's commuters will drop to 3 millions people, which is the lowest of the 60 year-period.
WRITE DESCRIPTION HERE
Top answer
Please post essays, paragraphs, dialogues and other writing in the essay forum so a moderator does not have to move your post. Click on this link: Next, tap on the green button "write a new post" Please read my advice for Task 1 essays: IELTS TASK 1: Hints, Tips And Advice Vocabulary Words For Task 1: Reference Post
- Please post essays, paragraphs, dialogues and other writing in the essay forum so a moderator does not have to move your post.
- Click on this link: Next, tap on the green button "write a new post" Please read my advice for Task 1 essays: IELTS TASK 1: Hints, Tips And Advice Vocabulary Words For Task 1: Reference Post
Get the Weekly English Kit 📬
New words, one handy idiom, and a 2-minute quiz — delivered to your inbox to keep your streak alive.
The line graph illustrates (Not a good verb choice. "Illustrate" is for pictures, maps, diagrams, and flow charts. It is not good for plots - graphs and charts.) compares the average number of commuters travelling by 3 difference transports (Do not use numerals for
 Related Questions