
Can you score it and give some comments, please?
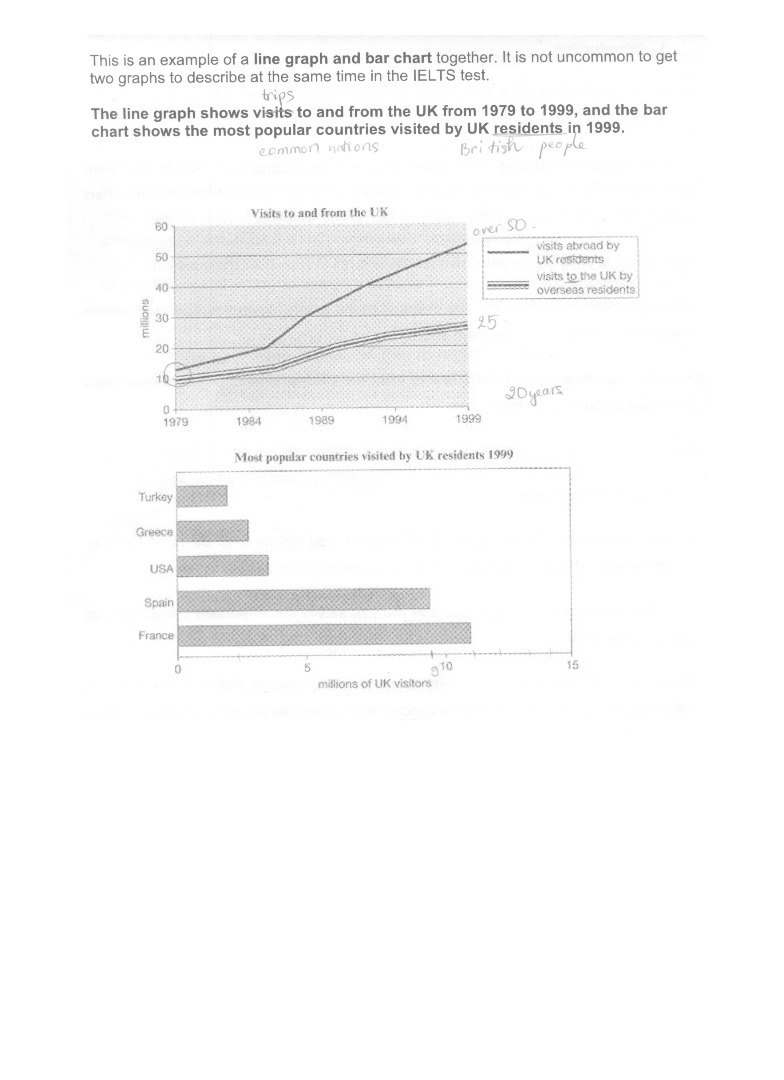
The graphs show changes and differences which took place in the number of trips from and to the UK over the period of 20 years, beginning at 1979 and the most common nations visited by British people in 1999.
At first glance, it can be clearly seen that both visitors from and to Britain experienced an upward trend over the survey period. Besides, France attracted the largest UK’s visitors while Turkey was the least popular country in this category in 1999.
To begin, there was a general increase in both the numbers of British people travelling abroad and oversea visitors coming to the UK. Both started at a low point of around 10 million in 1979. The figure for oversea residents visited the UK increased moderately to finish at over 25 by the end of the period while the size of abroad visits went by UK residents underwent a continual growth to exactly 20 million after 1984, where it shows an exponential climb, reaching a peak of over 50 by 1999, which was more than double that of the remaining group.
Turning to another main feature, differences in the degree of UK visitors was recorded in 1999. France stood at the highest point of about 11 million whereas only 2 million UK residents chose to go to Turley. Compared to Greece, USA and Spain, the figure were 3, 4 and 9 million correspondingly.
Get the Weekly English Kit 📬
New words, one handy idiom, and a 2-minute quiz — delivered to your inbox to keep your streak alive.
 Related Questions