
Can you review my writing task 1, Thank u so
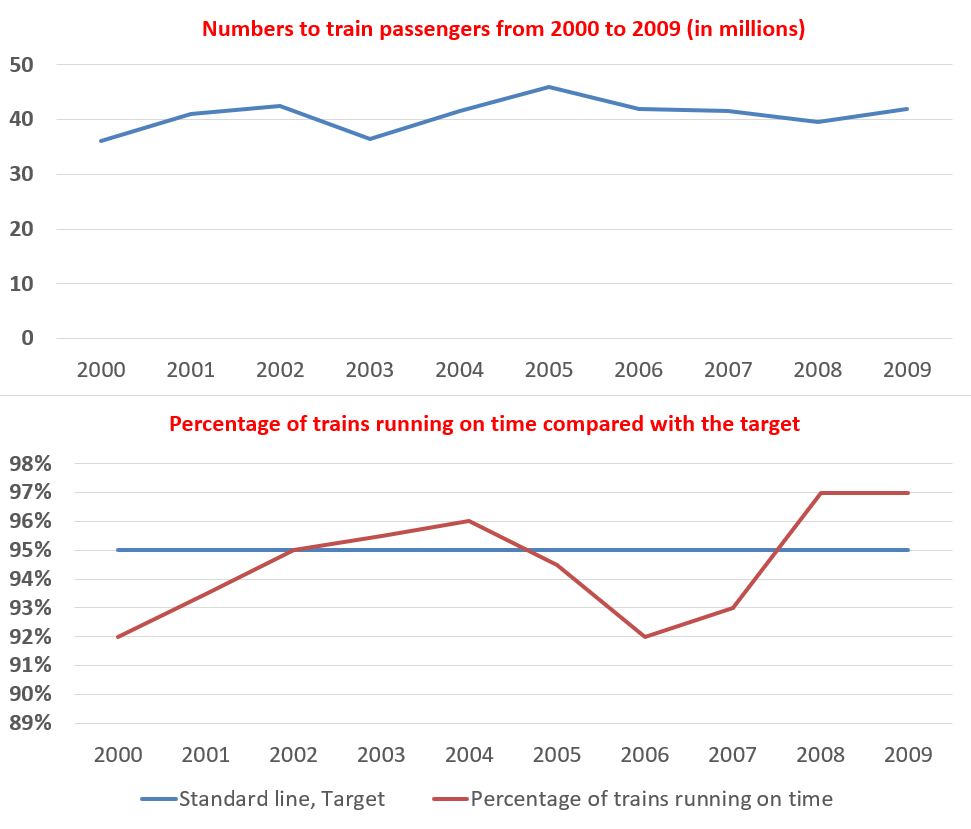
The first graph shows the number of train passengers from 2000 to 2009; the second compares the percentage of trains running on time and target in the period.
The upper chart illustrates the changes in the number of passengers traveling by trains and the lower graph shows the proportion of trains running punctually in a 10-year-period from 2000 to 2009 compared to the target.
Overall, it can be seen that the number of travelers using trains showed an unsteady upward trend. The figure for train running on time also saw the same minor fluctuation.
In the first four years, the number of train travelers rose from around more than 40 million, and then turned to its first peak of about 37 million in 2002 before dropping to just below its starting number in 2003. Also in that period, the proportions of trains running on time rose sharply from 92% to 95.5%. During the next three years, there was both enormous growth in the rate of train passengers and trains running on time, while the train travelers reached a peak of more than 45 million people in 2005. In terms of running efficiency, the rate was 96% in 2004, but later fell drastically to 92% in 2006
In the last three years, while the number of passengers stabilized around 43%, compared to the significant increase of trains running on time, with the gradual improvement and eventually the highest point of 97%
Top answer
You have not read my advice. You keep making the same mistakes. Your learning strategy is not a good on.
- You have not read my advice.
- You keep making the same mistakes.
- Your learning strategy is not a good on.
- You have posted many essays, but it is not clear that you are improving at all.
- You have to learn from your mistakes, not just post another essay repeating the same errors all over again.
Get the Weekly English Kit 📬
New words, one handy idiom, and a 2-minute quiz — delivered to your inbox to keep your streak alive.
You have not read my advice. You keep making the same mistakes.
Your learning strategy is not a good on. You have posted many essays, but it is not clear that you are improving at all. You have to learn from your mistakes, not just post another essay repeating the same errors all over again.
The upper chart (wrong word.) illustrates (wrong word, again. You repeat this same mistake for every Task 1) the changes (Incorrect. It does not plot the changes. It plots absolute numbers. You can then calculate the changes by using subt
 Related Questions