
Can you please give me some feedback on my Writing Task 1? Thank you!
The pie charts below show electricity generation by source in New Zealand and Germany in 1980 and 2010.
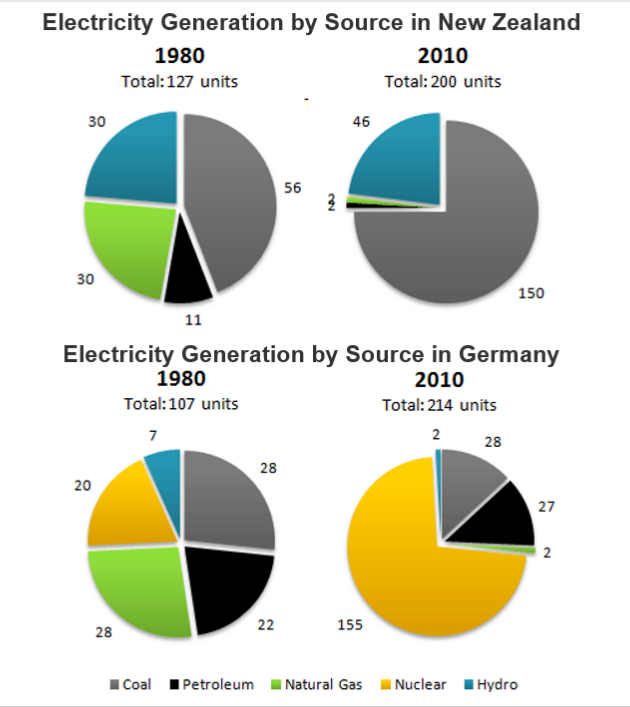
The pie four pie charts, dated 1980 and 2010, compare the amount of electricity produced by fossil fuels (coal, petroleum, and natural gas) and alternative sources (nuclear and hydro) in New Zealand and Germany.
Overall, quantities of electricity generation increased substantially over the 30-year period. While most electric power in New Zealand originated from coal, the most potential source in Germany was nuclear, despite a moderate amount in 1980.
With respect to New Zealand, a total of 127 units of electricity was generated in the initial year, and it showed a jump to 200 units in 2010. That is owing to a nearly threefold rise of coal source, from 56 units to 150 units. This trend was also joined by hydro, but to a much lower extent, which accounted for roughly 25% in each year. By contrast, decreases occurred in the other two non-renewable fuel sources, from a total of 41 units (natural gas triple petroleum) to merely 4 units.
In 1980, the three conventional sources almost evenly contributed to the total quantity of electricity generation (around a quarter each), but the data for coal and petroleum did not change much in the following 30 years. Although Germany produced slightly less electrical energy in 1980, it surpassed New Zealand by 14 units in 2010 due to a surge of 135 units in nuclear sources. Hydro was still least preferred by this nation, comprising minimal proportions in both years, with a declining trend.
Top answer
The pie four pie charts, dated 1980 and 2010 , (The reader is confused. You indicated by their labels, TWO pie charts - 1980 and 2010. Yet you wrote "four".
- The pie four pie charts, dated 1980 and 2010 , (The reader is confused.
- You indicated by their labels, TWO pie charts - 1980 and 2010.
- Yet you wrote "four".
- It makes no sense and just confuses the reader.
- ) compare the amount of electricity produced by three types of fossil fuels (coal, petroleum, and natural gas) and two alternative sources (nuclear and hydro) in New Zealand and Germany.
Get the Weekly English Kit 📬
New words, one handy idiom, and a 2-minute quiz — delivered to your inbox to keep your streak alive.
The pie four pie charts, dated 1980 and 2010, (The reader is confused. You indicated by their labels, TWO pie charts - 1980 and 2010. Yet you wrote "four". It makes no sense and just confuses the reader. You must thing very very logically when you write task 1.) compare the amount of electricit
The four pie charts compare the amounts of electricity generated from five different fuel sources in two countries, New Zealand and Germany, for two years,1980 and 2010. These sources are coal, petroleum, natural gas, nuclear, and hydro.
Overall, electricity production in both countries increased substantially. Germany became heavily reliant on nuclear energy. New Zealand did n
 Related Questions