
Can you help me with my ielts writing task , please. Thank you very much.
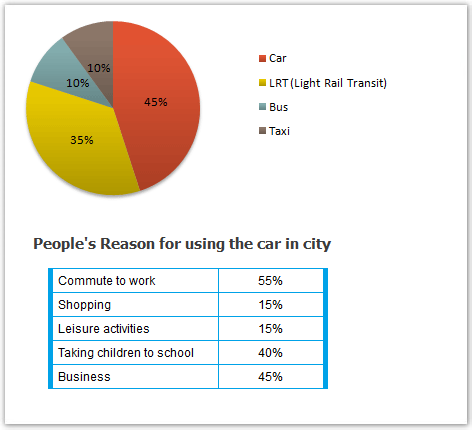
The pie chart illustrates four different types of transport used in Edmonton while the tale gives out information on the purpose of using them.
It is clear that car is the most favourable mean of transport and the mojority of residents use them to commute to work.
In the pie chart, car takes up nearly 50% of all the vehicles used in Edmoton. Light Rail Transit is in the second place with 35% only 10% less than car. Bus and taxi share the same percentage of 10% each.
For the table, the number one reason for using car is to commute to work with 55%. Business comes close with 45%. Another common reason for the citizen to use car is to take their children to school with only 5% less than the business group. And not a lot of people choose car to satisfy their personal needs which result in the percentage of two group shopping and leisure activities with only 16%.
Top answer
What are the instructions for this essay? Please read my advice for Task 1 essays. You will find many of your mistakes (highlighted in your text) explained here.
- What are the instructions for this essay?
- Please read my advice for Task 1 essays.
- You will find many of your mistakes (highlighted in your text) explained here.
- If you reply with the major mistakes fixed and the instructions, we can work on the remaining errors.
- IELTS TASK 1: Hints, Tips And Advice Vocabulary Words For Task 1: Reference Post The pie chart illustrates four different types of transport used in Edmonton (That is not what the pie chart shows) while the tale g ives out information on the purpose of using them.
Get the Weekly English Kit 📬
New words, one handy idiom, and a 2-minute quiz — delivered to your inbox to keep your streak alive.
What are the instructions for this essay?
Please read my advice for Task 1 essays. You will find many of your mistakes (highlighted in your text) explained here. If you reply with the major mistakes fixed and the instructions, we can work on the remaining errors.
 Related Questions