
Can you help me to check this essay? Thanks so much.
(Post edited by moderator to get the above image to display)
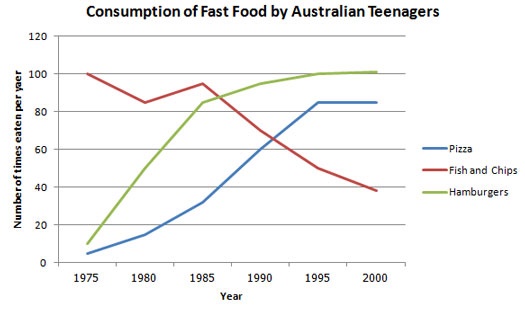
A glance at the chart provided illustrates the data on the times the Australian teenagers use junk food during the period from 1975 to 2000.
It is obvious that the number of times eaten fish and chips declined significantly. On the other hand, there was a steep rise in times of pizza and hamburgers consumption over 25 years.
In the first year, 1975, the most popular convenient food of Australian young was fish and chips. They were consumed 100 times a year. It was the highest level in that period while pizza and hamburgers were only eaten approximately 5 times a years. There was a considerable fluctuation in the number of times eaten fish and chips between 1975 and 1985. Then, it decreased dramatically about 60 times during the 15 years timescale.
Differently from fish and chips, the number of times used the other two fast food were extremely low at first. However, afterwards, they went up sharply until 1995. In the ultimate five years, they stayed at the same level after growth. Specially, the number of times eaten hamburgers achieved the maximum level which was similar to fish and chips in 1975 with consumption at 100 times a year.
Top answer
A glance at (Those words do not describe the chart. In Task 1, you report only what is in the graph, table, chart, or map. ) T he chart provided illustrates the data on the number of times per year / annually the Australian teenagers use (wrong word) junk food during the period from 1975 to 2000.
- A glance at (Those words do not describe the chart.
- In Task 1, you report only what is in the graph, table, chart, or map.
- ) T he chart provided illustrates the data on the number of times per year / annually the Australian teenagers use (wrong word) junk food during the period from 1975 to 2000.
- It is obvious that (Those words express your opinion ("obvious").
- ) .
Get the Weekly English Kit 📬
New words, one handy idiom, and a 2-minute quiz — delivered to your inbox to keep your streak alive.
A glance at (Those words do not describe the chart. In Task 1, you report only what is in the graph, table, chart, or map. ) The chart provided illustrates the data on the number of times per year / annually the Australian teenagers
 Related Questions