
Can you help me preview my essay and give me some suggestions to improve my score, please? - Writing task 1
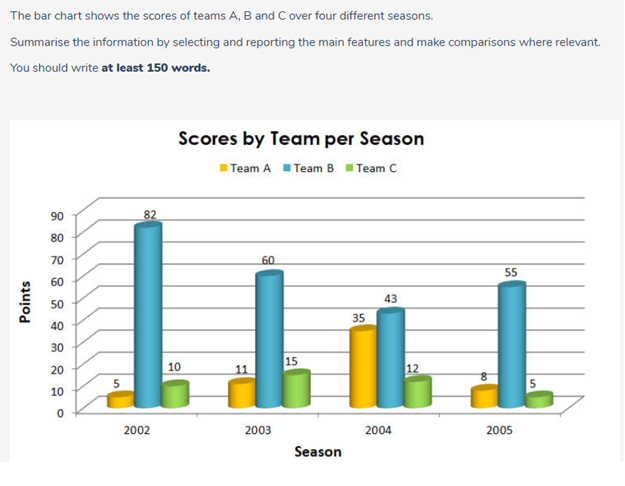
The chart illustrates the points of three teams which are scored in seasons 2002, 2003, 2004 and 2005.
Overall, the point of team B was the highest over four years, the opposite was true for the scores from teams A and C. While the score by team A was always lower than team B, in the last two years team A had the points higher than team C.
In 2002, team B had 82 points which was the highest score of the three teams, while the score of team C was 10 points and the point of team A was less than two times of team C. There was a slight increase in the scores of team A and C, respectively 11 and 15 points. By contrast, the year 2003 witnessed a marginal decrease of 22 in the point of team B.
In 2004, the point of team A was higher than the point’s team C, respectively 35 and 12 points. Meanwhile, the point of team B saw a slow fall to 43 before experiencing a steady growth of 12 in 2005. At the same time, the figures for teams A and C went down considerably below 10 points.
Top answer
Hi pen papaya, I see that your posts are approved automatically. It means you're experienced enough to use the forum properly. htm Moved.
- Hi pen papaya, I see that your posts are approved automatically.
- It means you're experienced enough to use the forum properly.
- htm Moved.
Get the Weekly English Kit 📬
New words, one handy idiom, and a 2-minute quiz — delivered to your inbox to keep your streak alive.
Hi pen papaya,
I see that your posts are approved automatically. It means you're experienced enough to use the forum properly.
So, please post your essays in our writing forum:
https://www.englishforums.com/English/EssayReportCompositionWrit
 Related Questions