
Can you help me check this Task 1 Writting?
The first bar chart compares the status of marriages and divorces of American. The data plotted is the number of people (million) in four years: 1970, 1980, 1990 and 2000. The second bar chart compares the different marital status of adult Americans in two years 1970 and 2000. The data is the percentage of adult status of four categories: married, never married, widowed and divorced.
Overall, there were almost two times the number of marriages than divorces in each year. Additionally, the percentage of married adults were higher than other marital status in both years 1970 and 2000.
For the first bar chart, the rate of the number of marriages than divorces was 2.5 times (1970), 1.8 times (1980), 2.1 times (1990), and 2 times (2000). While, the number of marriages gradually went down, then the number of divorces remain stable around 1 million people in during the period. For the second bar chart, the number of married adults was highest in both years, but, there were declines about 10% in 2000 compared to 1970. While, the percentage of those who never married, widowed increased 5% and 7%, respectively. The percentage of Americans who widowed decreased about 2% after 30 years.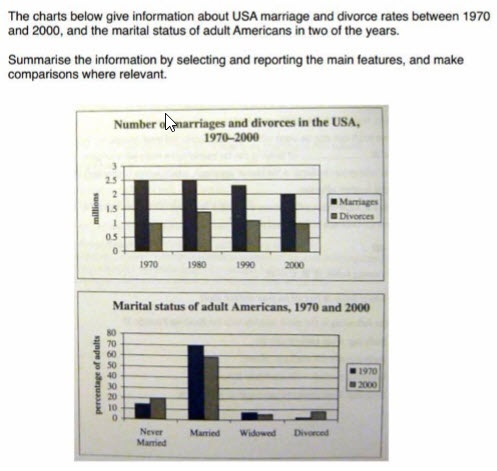
Top answer
The first bar chart compares the status (Incorrect. ) of marriages and divorces of American . (American is an adjective.
- The first bar chart compares the status (Incorrect.
- ) of marriages and divorces of American .
- (American is an adjective.
- ) The data plotted is the number of people (million) in four years: 1970, 1980, 1990 and 2000.
- The second bar chart compares the different marital status of adult Americans in two years 1970 and 2000.
Get the Weekly English Kit 📬
New words, one handy idiom, and a 2-minute quiz — delivered to your inbox to keep your streak alive.
The first bar chart compares the status (Incorrect. That is not what is on the first chart.) of marriages and divorces of American. (American is an adjective. An American is one person.) The data plotted is the number of people (million) in four years: 1970, 1980, 1990 and 2000. The seco
 Related Questions