
Can you help me check my writing task 1 ielts?3.4
4.The chart below shows the changes that took place in three different areas of crime in Panama City from 2010 to 2019.
Summarise the information by selecting and reporting the main features, and make comparisons where relevant.
Write at least 150 words.
The graph shows the rates of crime in Panama city from 2010 to 2019. Overall, the number of burglary changed dramatically, meanwhile, the amount of car theft and robbery keep stable.
From 2010 to 2013, the burglary occurs most regularly in Panama city. At this time, the number of car theft is on average, from 2000 to 2800 incidents per year. The lowest incident is in robbery and its number keep steady.
From 2013 to 2019, the tendency of burglary is decreased, especially in 2015, the amount of burglary is only 1000 incidents, less than 3,5 times with the peak year- 2011. In contrast, there is a upward trend in car thefts. The robbery in Panama city do not fluctuate at this time.
To sum up, from 2010 to 2019, the amount of burglary tends to decrease while the incidents of car theft and robbery always keep stable.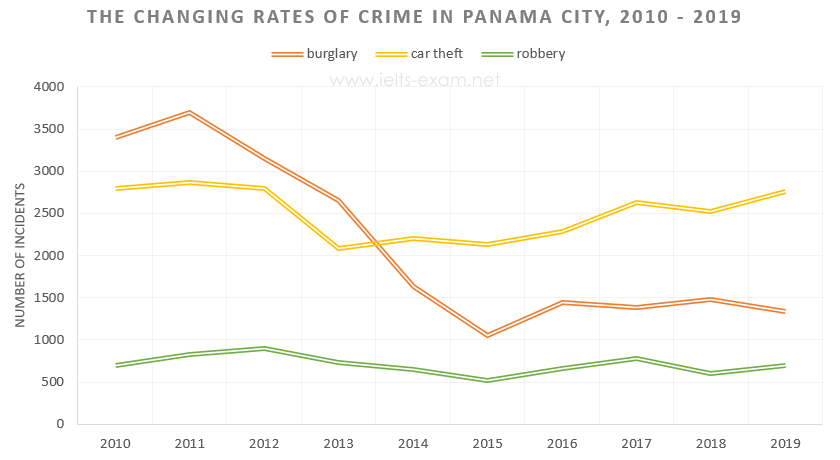
Top answer
Please post essays, paragraphs, dialogues and other writing in the essay forum so a moderator does not have to move your post. htm
- Please post essays, paragraphs, dialogues and other writing in the essay forum so a moderator does not have to move your post.
- htm
Get the Weekly English Kit 📬
New words, one handy idiom, and a 2-minute quiz — delivered to your inbox to keep your streak alive.
Please post essays, paragraphs, dialogues and other writing in the essay forum so a moderator does not have to move your post.
https://www.englishforums.com/English/EssayReportCompositionWriting/Forum9.htm
 Related Questions