
Can you help me check my writing task 1 ielts?3.3
3.The charts below show local government expenditure in 2010 and 2015.
Summarise the information by selecting and reporting the main features, and make comparisons where relevant.
Write at least 150 words.
The two pie charts illustrate the expenditure of ten fields which government spends money on 2010 and 2015.
What stand out is that in both two graphs, education expenditure accounts for highest percentage, 24% in 2010 and 21% in 2015. Moreover, health care and pension also make up a large proportion of government expenditure. These fields keep stable percentage in 2010 and 2015, about 20%.
There is a slight decrease in the expenditure of defence, from17%, it fall down to 14%. In contrast, government spends more money on welfare and interest on borrowing in 2015 than 2010. Especially, the expenditure on interest on borrowing rises by a half, from 5% to 10%.
Finally, transport, culture and leisure take a small proportion in both charts. Their tendency is falling down from 3% and 2% in 2010 to 1% in 2015.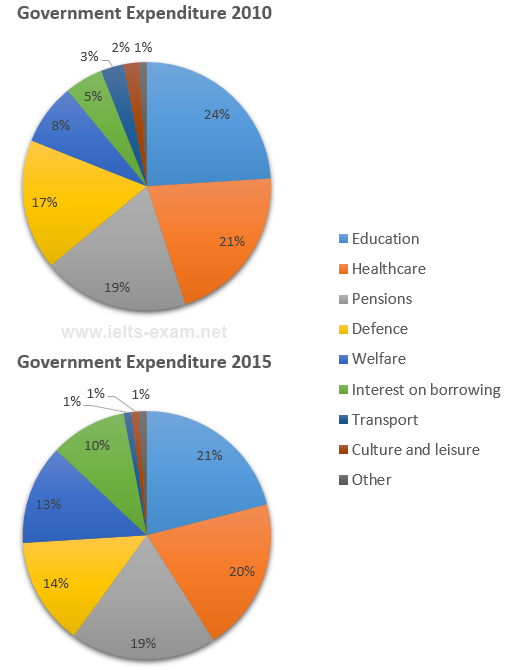
Top answer
Please post essays, paragraphs, dialogues and other writing in the essay forum so a moderator does not have to move your post. htm You can review my comments on another student's submission of this task. htm
- Please post essays, paragraphs, dialogues and other writing in the essay forum so a moderator does not have to move your post.
- htm You can review my comments on another student's submission of this task.
- htm
Get the Weekly English Kit 📬
New words, one handy idiom, and a 2-minute quiz — delivered to your inbox to keep your streak alive.
Please post essays, paragraphs, dialogues and other writing in the essay forum so a moderator does not have to move your post.
https://www.englishforums.com/English/EssayReportCompositionWriting/Forum9.htm
You can review my comments on an
 Related Questions