
Can you guys comment on my task 1 IELTS Writing please. Thank you.
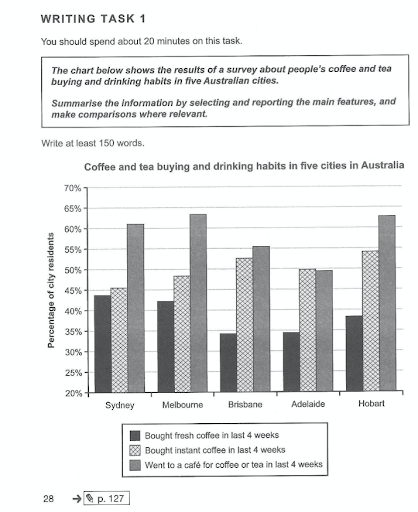
The given bar chart represents the purchasing and consuming trend in coffee and tea in Sydney, Melbourne, Brisbane, Adelaide, and Hobart in the last 4 weeks.
Overall, the amount of residents that went to cafes was highest in all cities, with the exception of Adelaide, where instant coffee was more favored. In contrast, buying fresh coffee was the most uncommon option.
In terms of Sydney and Melbourne, the percentage of people consuming beverages in a cafe was roughly 61% in Sydney, as opposed to Melbourne which was approximately 63%. Moreover, about 48% of Melbourne's people and 45% of Sydney's people bought instant coffee throughout the period meanwhile these figures for purchasing fresh coffee in two cities were around 44% and 42% respectively.
Moving on to the remaining cities, going to cafes was the most common activity in Hobart (around 63%), followed by Brisbane and Adelaide, which were roughly 55% and 50% respectively. About 54% of the surveyed participants in Hobart bought instant coffee, only slightly higher than those in Brisbane (53%) and Adelaide (50%). Lastly, the percentage of residents who bought fresh coffee remained the smallest, with approximately 38% in Hobart and just below 35% in the other two.
Please leave a comment on how my writing can be improved and predict a band score for this if possible. Thank you!
Top answer
The given (Do not use "given" or "provided". ) bar chart represents (wrong word) the purchasing and consuming trend (wrong word) in coffee and tea (wrong phrase) in Sydney, Melbourne, Brisbane, Adelaide, and Hobart in the last 4 weeks. ) Overall, the amount (wrong word - amount is for non-count items.
- The given (Do not use "given" or "provided".
- ) bar chart represents (wrong word) the purchasing and consuming trend (wrong word) in coffee and tea (wrong phrase) in Sydney, Melbourne, Brisbane, Adelaide, and Hobart in the last 4 weeks.
- ) Overall, the amount (wrong word - amount is for non-count items.
- g.
- Amount of water, amount of money, amount of food, amount of rice.
Get the Weekly English Kit 📬
New words, one handy idiom, and a 2-minute quiz — delivered to your inbox to keep your streak alive.
The given (Do not use "given" or "provided". It is unnatural.) bar chart represents (wrong word) the purchasing and consuming trend (wrong word) in coffee and tea (wrong phrase) in Sydney, Melbourne, Brisbane, Adelai
 Related Questions