
Can you give me some feedback on my writing task 1?
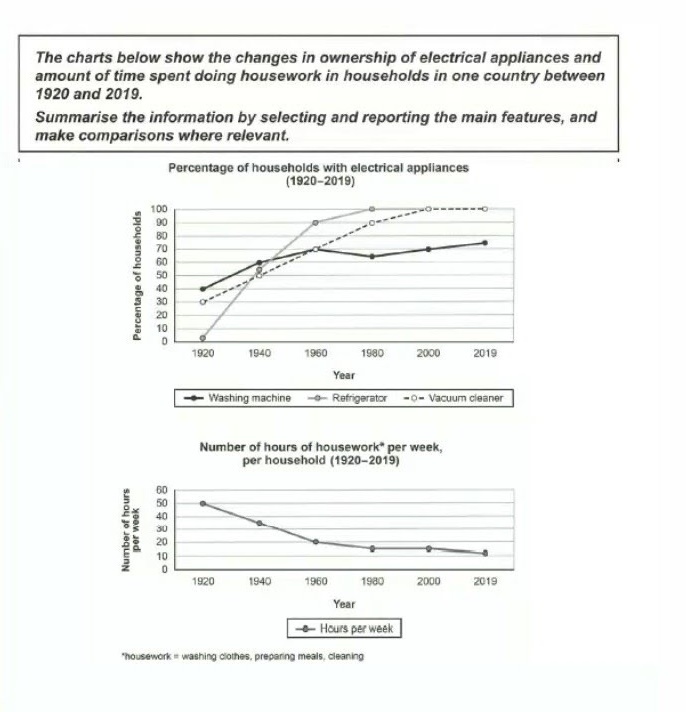
The first line graph compares differences in the number of households with electrical appliances and the second one demonstrates the amount of time people spent on doing housework each week from 1920 to 2019.
Overall, there was an upward trend in the use of washing machines, refrigerators and vacuum cleaners, and the possession of refrigerators rose at the highest rate. Consequently, the number of hours spent on household chores decreased significantly during this period.
In 1920, forty percent of the households owned washing machines, which was 10% higher than the ownership of vacuum cleaner. After 60 years, the number of families having refrigerators and vacuum cleaners rose sharply to 100% and 80% respectively. While vacuum cleaners were used in roughly 65% of the households, all families owned two other electrical appliances in 2019.
It is clear that people spent 50 hours each week on doing housework in 1920. Between 1920 and 1980 the number of hours spent on household chores saw a drop of 30 hours. In 2019, with the use of electrical appliances people only spent 10 hours per week on housework. (183)
Thank you for helping me!
Top answer
Please read my advice for Task 1 essays: IELTS TASK 1: Hints, Tips And Advice Vocabulary Words For Task 1: Reference Post
- Please read my advice for Task 1 essays: IELTS TASK 1: Hints, Tips And Advice Vocabulary Words For Task 1: Reference Post
Get the Weekly English Kit 📬
New words, one handy idiom, and a 2-minute quiz — delivered to your inbox to keep your streak alive.
The first line graph compares differences (There are no differences on this plot.) in the number (wrong word. Numbers are values such as 54,821,453 or 429 or 1,483) of households with electrical appliances and the second one (Write a new
Sample essay:
The first line graph plots the percentage of homes which had a labor-saving electrical appliance between 1920 and 2019. Three appliances are shown: refrigerator, vacuum cleaner and washing machine. The second line graph plots the average amount of time each family spent weekly on common household chores during the same period.
Overall, a steadily incr
 Related Questions