
Can you give it a general band score, please?
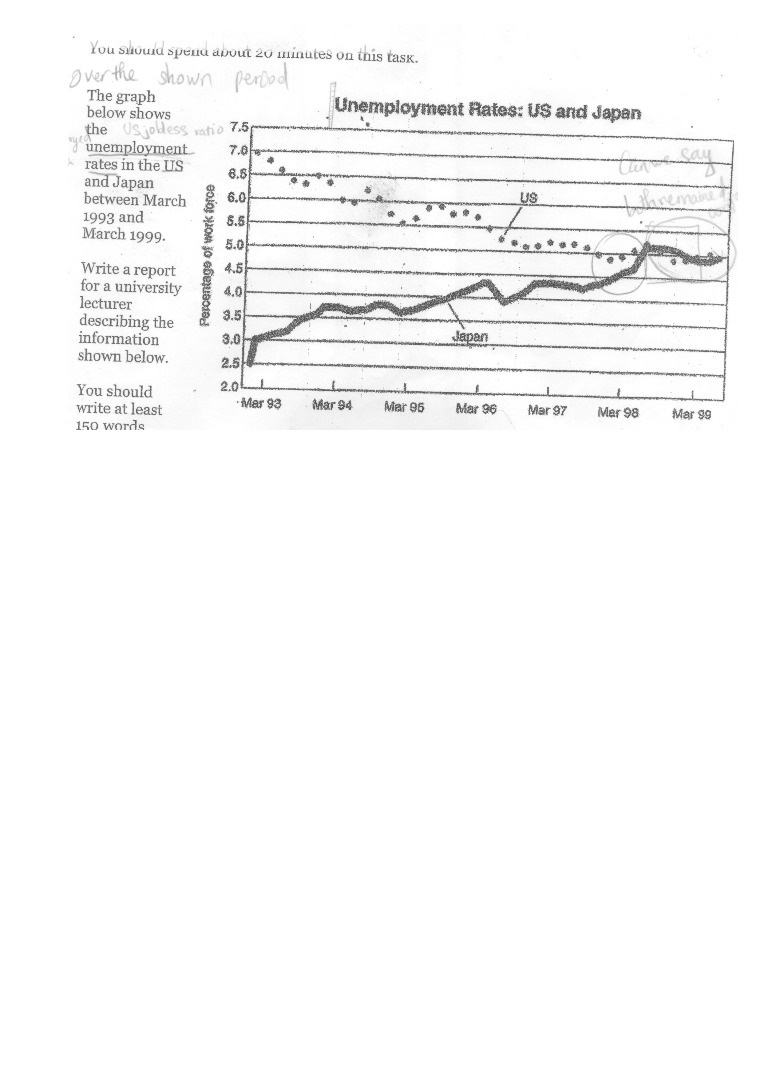
The line graph presents how the proportion of unemployed people changed in Japan and USA from March 1993 to March 1999.
Overall, the percentages of unemployed Americans decrease slightly while there was a doubled growth in the unemployment in Japan during the mentioned period.
To begin, in March 1993, around 2.5% were unemployed Japanese, standing at the lowest point. The figure for un-employees in Japan rose dramatically until later than March 98, reaching a peak of more than 5%, then fluctuatingly dropping to exactly 5% in March 1999.
By contrast, the percentages of unemployed Americans totalled=totaled at 7%, making the highest point in March 1993 compared to that of Japanese. Then there was a fluctuation and gradual fall to 5% between March 1993 and March 1997, remaining stable until overtook those for Japanese between March 1998 and March 1999.
In conclusion, in spite of the opposite trends in US and Japan during the period, they overtook = exceeded with 5% from around March 1998 to March 1999.
Some words in bold that is what I wanna ask for the usage as well as acuracy.
The second essay:
The line graph provides information about what percentage of the jobless in America and Japan over a six-year period from March 1993 to March 1999.
Overall, it can be clearly seen that America unemployment rate decreased substantially while Japan experienced a moderate growth over the survey period.
Turing to the first main feature, there was a general drop in the US jobless ratio over the course of the survey period. This rate began at a high of exactly 7% in March 1993, then witnessed a continual fluctuation before falling slightly to 5% by March 1999, which was a modest 2% lower than the former level.
By contrast, Japanese unemployment rate started at a mere of precisely 2.5% in March 1993, continuing to fluctuate to finish at 5% by March 1999, which was twice the original figure. It is interesting to note that the proportion of Japanese unemployed workers exceeded that of the US within one year from March 1993 to March 1999.
Can you score it, please?
Top answer
I have no experience at scoring IELTS essays. I would say it is around a 6. The line graph presents how the proportion of unemployed people unemployment rates changed in Japan and USA from March 1993 to March 1999.
- I have no experience at scoring IELTS essays.
- I would say it is around a 6.
- The line graph presents how the proportion of unemployed people unemployment rates changed in Japan and USA from March 1993 to March 1999.
- Overall, the percentages of unemployed Americans decrease (wrong form) slightly (?
- I would not call a 28% decrease "slight") while there was a it doubled growth in the unemployment in Japan during the mentioned period.
Get the Weekly English Kit 📬
New words, one handy idiom, and a 2-minute quiz — delivered to your inbox to keep your streak alive.
I have no experience at scoring IELTS essays. I would say it is around a 6.
The line graph presents how the proportion of unemployed people unemployment rates changed in Japan and USA from March 1993 to March 1999.
Overall, the percentages of unemployed Americans decrease (wrong form) slightly
The second essay:
The line graph provides information about what percentage of the jobless in America and Japan over a six-year period from March 1993 to March 1999. ("What" does not fit the structure of the sentence. If you use "what", you must write a different sentence ... what the unemployment rates in America and J
 Related Questions