
0
Candle aqua 499 Posted 6 years ago
Essay & Composition Writing
Can you check this essay for me please ? What band scores will I get ?
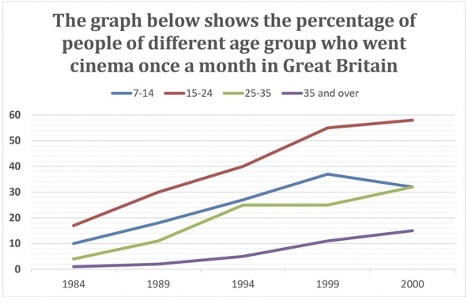
The line graph compares the proportion of four different age groups of cinema-goers in Great Britain over a period of 16 years ( 1984-2000).
Overall, while people aged 15-24 accounted for the greatest percentage of cinema visitors throughout the period shown, a reserve pattern can be seen to the proportion of those aged 35 and over.
In 1984, the percentage of people between 15 and 24 was highest, at more than 15%, followed by the figure for 7-14 and 25-35 age groups, took up 10% and 5% respectively. By contrast, the percentage of people who went cinema over 35 years old was negligible.
From 1989 to 2000, the proportion of cinema visitors from the youngest group increased dramatically and reached a peak of 38% in 1999, then this number experienced a slight fall of 5% by 2000. The three remaining figure including 15-24,25-35, over 35 age groups continued to rise to 60%, 22% and 15% in that order at the end of the period. ( 169 words )
WRITE DESCRIPTION HERE
Top answer
Please read my advice for Task 1 essays. IELTS TASK 1: Hints, Tips And Advice Vocabulary Words For Task 1: Reference Post The line graph compares the proportion of people who attended the cinema monthly in four different age groups of cinema-goers in Great Britain over a period of 16 years ( 1984-2000). (incomplete.
- Please read my advice for Task 1 essays.
- IELTS TASK 1: Hints, Tips And Advice Vocabulary Words For Task 1: Reference Post The line graph compares the proportion of people who attended the cinema monthly in four different age groups of cinema-goers in Great Britain over a period of 16 years ( 1984-2000).
- (incomplete.
- ) Describe the graph in all aspects.
- If you name the age groups, you can refer to them by name in the body paragraphs.
Get the Weekly English Kit 📬
New words, one handy idiom, and a 2-minute quiz — delivered to your inbox to keep your streak alive.
1 Answers
0
 Related Questions