
Can you check my writing task 1? Thank you!
The graph below shows how elderly people in the United States spent their free time between 1980 and 2010. Summarise the information by selecting and reporting the main features, and make comparisons where relevant.
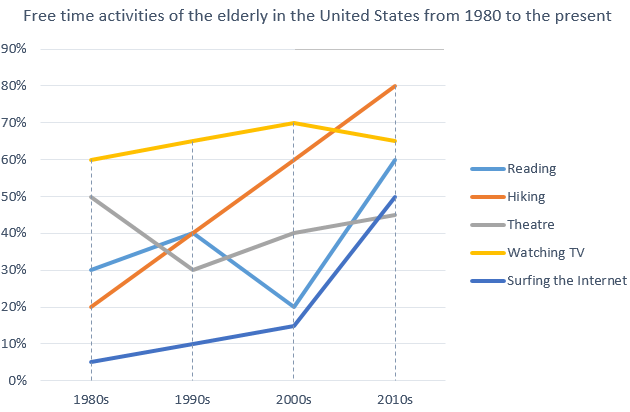
The graph demonstrated the various forms of entertainment which the old age population in the United States preferred doing in their leisure time. Overall, there were increasing trends in different activities in 30 years, notably, watching TV had been an all-time favourite.
To commence with, between 1980s and 1990s, every hobby had a tendency of climbing gradually except for going to the theatre. The majority of recreation rose by about 5%, the most significant growth was hiking. Otherwise, the pattern of visiting cinema substantially dropped by 20%.
Over the following 10-year period, all kinds of amusement continuously uplifted with the moderate speed. However, reading witnessed a downward trend with a significant slump from 40% to 20%. On the contrary, old people took more interest in theatre, the ratio increased by 10%.
Finally, in the decade of 2000s to 2010s, the most outstanding point was hiking reached the peak without being interrupted. Besides, after the sudden decrease, reading recorded a positive fluctuation by 40%. Surfing the Internet did not remain steady, roared from nearly 15% to 50%. Nevertheless, while in the previous period, watching TV hit the highest point, it minimally fell at this time.
Top answer
The graph demonstrated (Wrong word, wrong tense. ) the various forms of entertainment (Not a good phrase. "Hiking" is not really entertainment.
- The graph demonstrated (Wrong word, wrong tense.
- ) the various forms of entertainment (Not a good phrase.
- "Hiking" is not really entertainment.
- It is a physical activity.
- ) which the old age population in the United States preferred (Not a good word.
Get the Weekly English Kit 📬
New words, one handy idiom, and a 2-minute quiz — delivered to your inbox to keep your streak alive.
The graph demonstrated (Wrong word, wrong tense. Do not use the past tense when describing the figure.) the various forms of entertainment (Not a good phrase. "Hiking" is not really entertainment. It is a physical activity. Besides, you need to tell the reader how many curves are on the grap
Overall, there were was an increasing trend of participation in all five activities. in different activities in 30 years, notably, watching TV had the highest percentages except in the last decade.
 Related Questions