
CAN YOU CHECK MY IELTS WRITING TASK 1. MANY THANKS
QUES: The graph shows the percentages of people going to cinemas in a European country on different days.
The bar chart given provides a comparison of the proportion of European citizens coming to movie theaters on particular days in 2003, 2005 and 2007.
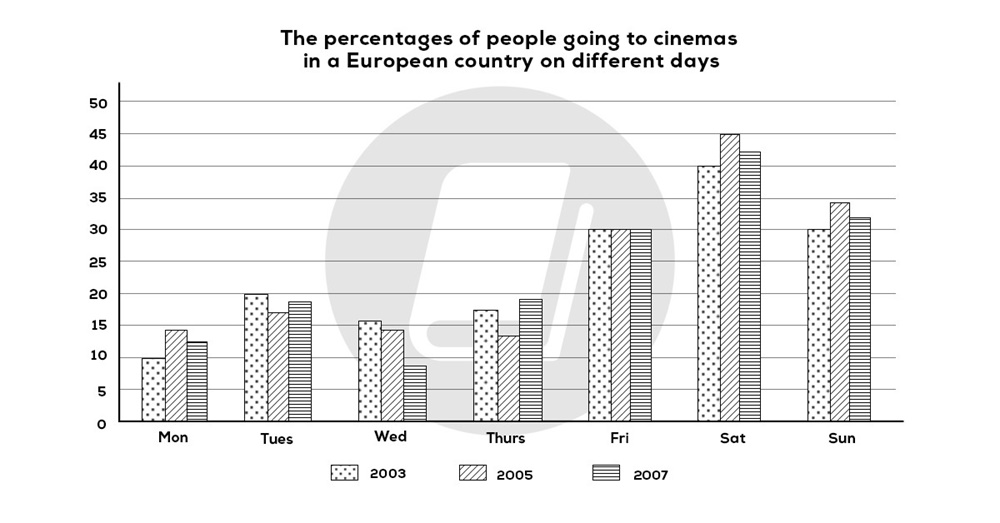
From an overall perspective, it is evident that people often went to cinemas at the weekend than those during the workday. Another interesting point is the percentage in 2005 on Saturday and Sunday always the highest.
In 2003, the portion of residents going to movie house reached a peak at 40% in Sat, meanwhile, the amount in Fri and Sun both remained stable at around 30%. It went the same as the two years, 2005 and 2007, with the peak at 45% and just over 42% respectively. By contrast, the percentage of THE figure in three years of the survey, in other days stood at around 10% to 20 %.
The data represented in Friday witnessed an unchanged proportion consist of 30 percent in all three years. As opposed to the number of people who go out to watch movie at weekend, the percentage of those who go for workday is lower from three to five times.
Top answer
Please read my advice for Task 1 essays: IELTS TASK 1: Hints, Tips And Advice Vocabulary Words For Task 1: Refere
- Please read my advice for Task 1 essays: IELTS TASK 1: Hints, Tips And Advice Vocabulary Words For Task 1: Refere
Get the Weekly English Kit 📬
New words, one handy idiom, and a 2-minute quiz — delivered to your inbox to keep your streak alive.
Please read my advice for Task 1 essays:
The bar chart given provides a comparison compares of the proportions of European citizens (incorrect) coming to movie theaters on particular the seven days
 Related Questions