
Can you check my IELTS writing?
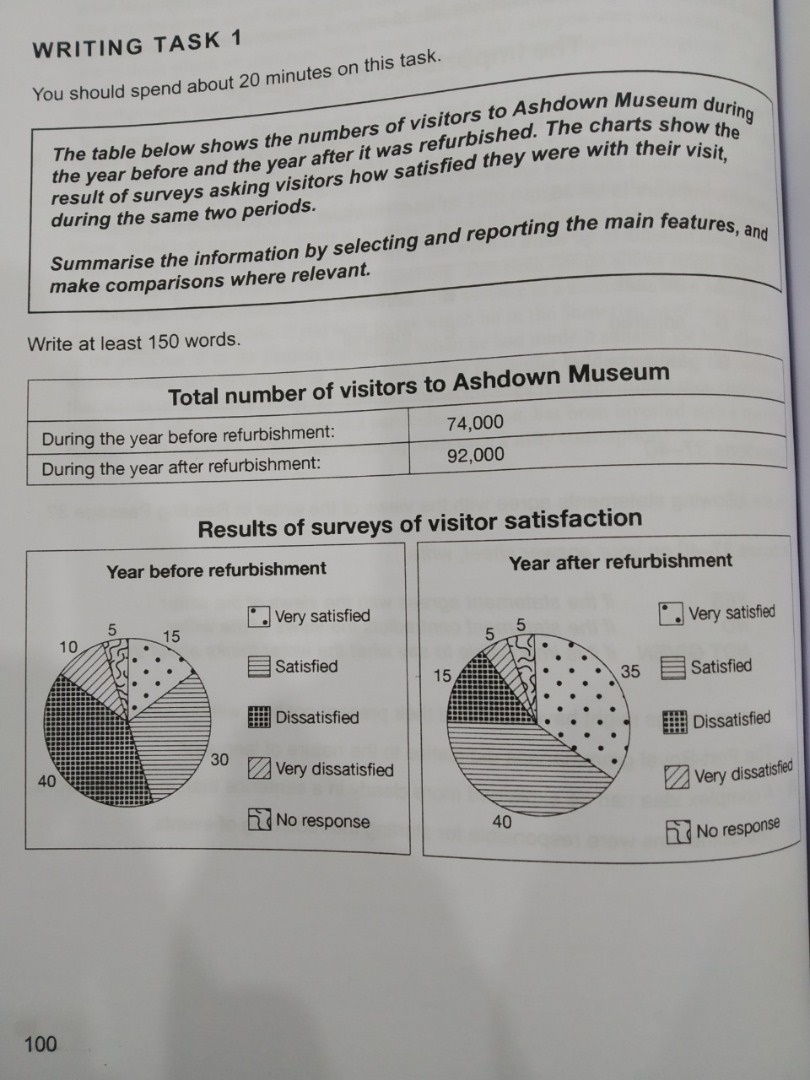
The table shows the comparison of the number of visitors to Ashdown Museum during the year before and the year after its renovation, while the two pie charts compare the visitors' satisfaction with their experience at the museum over the same two periods.
Overall, more visitors traveled to the museum after the refurbishment. Besides, there was a considerable increase in the number of visitors who were satisfied with their time spent at the museum.
In detail, during the year before refurbishment, 74,000 visitors went to the museum. The number of visitors who felt disappointed accounted for the highest percentage, at about 40%. Meanwhile, 30% of people who took part in the survey were satisfied after the trip. The proportion of very satisfied museum visitors was 15%, while the number of very dissatisfied customers was slightly lower, at around 10%. There was an increase in the total number of visitors to 92,000 during the year after the museum renovation. In that year, the proportion of satisfied visitors rose by 10% and became the highest value. The number of very satisfied people doubled to 35%. Meanwhile, there was a significant decline in the number of people who felt disappointed from 40% to 15%. The number of very dissatisfied visitors halved, at about 5%. During the same two periods, the proportion of people who have no response to the survey remained unchanged, at 5%.
Top answer
The table shows the comparison of the number of visitors to Ashdown Museum during the year before and the year after its renovation, while the two pie charts compare the visitors' satisfaction with their experience at the museum over the same two periods. Overall, more visitors traveled to the museum after the refurbishment. Besides, there was a considerable increase in the number of visitors who were satisfied with their time spent at the museum.
- The table shows the comparison of the number of visitors to Ashdown Museum during the year before and the year after its renovation, while the two pie charts compare the visitors' satisfaction with their experience at the museum over the same two periods.
- Overall, more visitors traveled to the museum after the refurbishment.
- Besides, there was a considerable increase in the number of visitors who were satisfied with their time spent at the museum.
- In detail, during the year before refurbishment, 74,000 visitors went to the museum.
- The number of visitors who felt disappointed accounted for the highest percentage, at about 40%.
Get the Weekly English Kit 📬
New words, one handy idiom, and a 2-minute quiz — delivered to your inbox to keep your streak alive.
 Related Questions