
Can you check my IELTS writing?
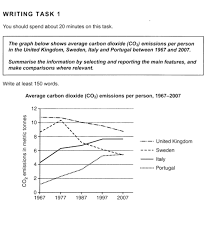
The line graph compares the amount of carbon dioxide emitted in four Western nations betweenn1967 and 2007.
Overall, the emission of carbon dioxide in Portugal and Italy experienced an increase, while that of the United Kingdom and Sweden dropped. Besides, throughout the period, the carbon footprint of the United Kingdom was the highest.
From 1967 to 1997, the carbon dioxide emission of Italy rose gradually by about 3.7 metric tonnes. It reached its peak of around 7.8 in 1997 and remained unchanged for the rest of the period. Likewise, there was a continuous growth in that of Portugal from about 1.6 to 5.7 metric tonnes.
Contrary to those two countries, both the UK and Sweden CO2 witnessed a decline in the carbon footprint. The amount of carbon dioxide discharged in the UK fell continuously, while there was a significant ascent to about 10.1 in 1977 and then an enormous fall for the rest of the period in Sweden.
P/s: Can you give me a score for my exercise? I want to know where I'm standing now.
Get the Weekly English Kit 📬
New words, one handy idiom, and a 2-minute quiz — delivered to your inbox to keep your streak alive.
 Related Questions