
Can you check my IELTS writing?
I. Test 1 ( Cam 13 test 1 writing task 1)
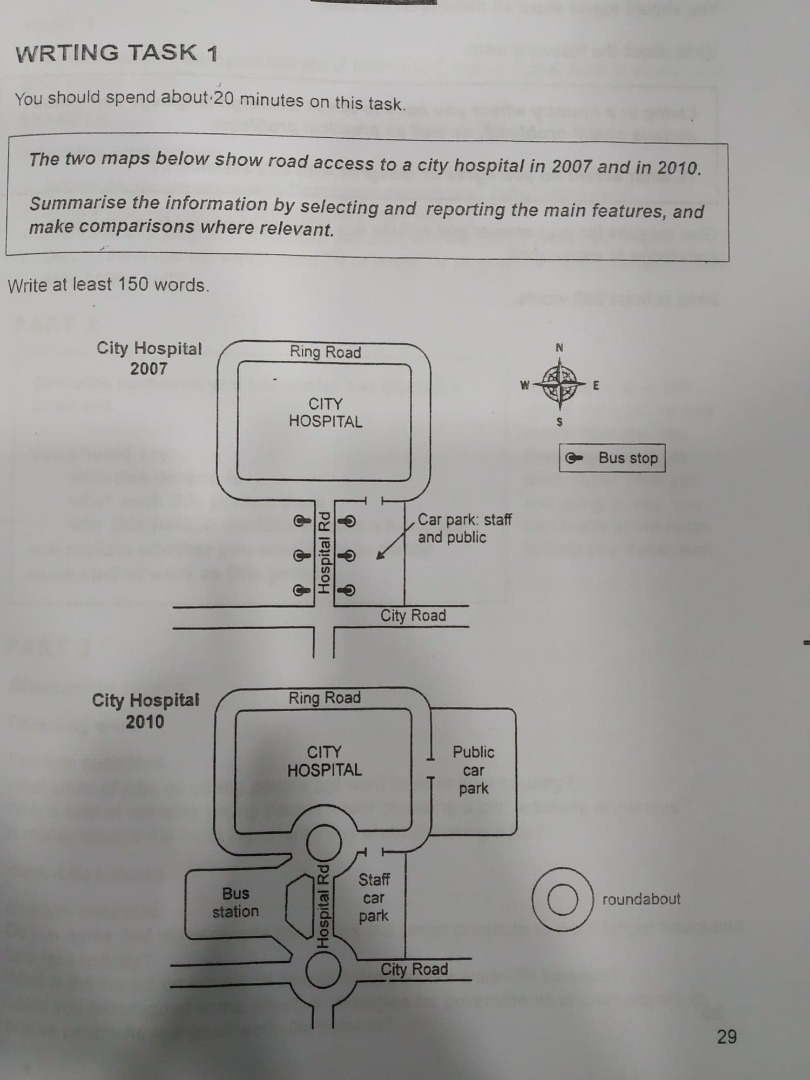
Two pictures illustrate the changes of the way get to a city hospital in two different years.
In 2007, the city hospital had one parking lot for both staff and public. It was in the south of the hospital and among the Hospital Road, the Ring Road and the City Road. In 2010, the parking has been expanded and divided into two particular areas: one for public and one for hospital's employees. Public parking has been built eastwards the hospital while private car park has occupied in the place of the former parking.
One of the changes in the structure of the route is about bus stops. There were six waiting-for- bus spots along the Hospital Road in 2007 and all of them have been exchanged for a new bus station three years later. Other change is the appearance of two roundabout. The first around-turn is at the intersection of the City Road and the Hospital Road. The second one is between the Ring road and the Hospital road. Both are connected to the bus station.
Overall, there are three new features between 2007 and 2010: a new bus station, two new traffic circle, and two car parks. One feature remains is the city hospital.
II. Test 2 ( Cam 13 test 2 writing task 1)
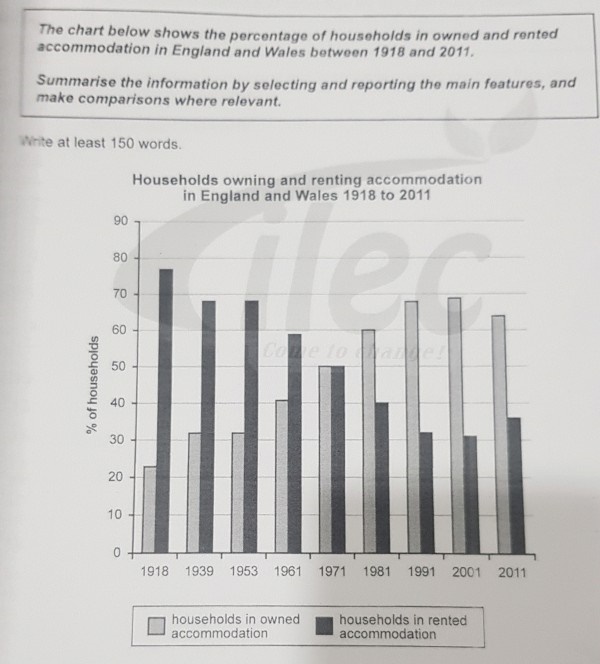
The given bar chart illustrates the proportion of owning and renting houses in England and Wales from 1918 to 2001.
During 93 years, the number of renting houses was the highest in 1918. It was nearly 80%. However, it declined each year from 1939 to 2001. In 1939 and 1953, rented accomodation contributed around 70% and respectively 60%, 50%, 40% and 30% in 5 years later. In the final year of that period, the statistic increased to nearly 40%.
By contrast, the percentage of owning houses increased annually. In 1918, it was above 20%, reached 30% 21 years later and did not change in 1953. The amount of bought accomodation in 1971 was 50%, the same as rented houses and it went on ballooning. Nevertheless, in the last year, 2001, the proportion decreased a bit and it was about 65%.
Overall, between 1918 and 2001, the amount of renting houses decreased each year whilst owning houses developed. In 1971, both were 50%.
Top answer
In future, please do not lump your texts like that. Post them in separate threads. --------------------------------------------------------------------------------- [ 1] The t wo pictures illustrate the changes that took place in the layout of the roads at the site of of the way get to a city hospital between 2007 and 2010.
- In future, please do not lump your texts like that.
- Post them in separate threads.
- --------------------------------------------------------------------------------- [ 1] The t wo pictures illustrate the changes that took place in the layout of the roads at the site of of the way get to a city hospital between 2007 and 2010.
- in two different years.
- [ 2] Overall, there are three new features were added: between 2007 and 2010: a new b us station, two roundabouts, new traffic circle, and two car parks.
Get the Weekly English Kit 📬
New words, one handy idiom, and a 2-minute quiz — delivered to your inbox to keep your streak alive.
In future, please do not lump your texts like that. Post them in separate threads.
---------------------------------------------------------------------------------
[ 1] The two pictures illustrate the changes that took place in the layout of the roads
 Related Questions