
Can someone give me feedback for this Task 1 essay? Thanks a lot.
The table below shows the numbers of visitors to Ashdown Museum during the year before and the year after it was refurbished. The charts show the result of surveys asking visitors who satisfied they were with their visit, during the same two periods.
Summarise the information by selecting and reporting the main features and make comparison where relevant.
The table illustrates how many tourists visited Ashdown Museum the year before and after its renovation while the pie charts compare five levels of people’s satisfaction when people were in this destination in the same two years.
It is noticeable that in the table, there was a substantial rise in the number of tourists after the museum’s improvement. Also, in the pie charts, the proportion of satisfaction after changes went up compared to the year before.
To begin with, in the table, before being refurbished, the museum only welcomed 74,000 people but after the renovation, the number of visitors increased to over 90.000.
Looking at the two pie charts, the proportion of people voting for dissatisfaction accounted for nearly a half, which remained the same over two periods, and it was by far the highest category. Meanwhile, the figure for people feeling very discontent with the destination fell marginally, from 10% to 5%. Additionally, the percentages of people feeling satisfied and extremely satisfied with the trip both saw a slight increase after the museum was renovated, from 30% to 35% and 5% to 10%.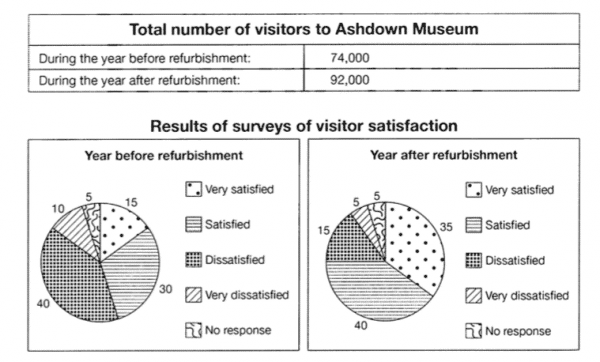
Get the Weekly English Kit 📬
New words, one handy idiom, and a 2-minute quiz — delivered to your inbox to keep your streak alive.
 Related Questions