
Can anyone check for me ?
The bar chart illustrates local – fixed line , national and international – fixed line and mobiles in terms of how many mintutes (in billions) did the UK use between 1995 and 2002.
Overall, it is clear that there three kinds of telephone calls in the UK saw a significant rise over the 7 – year period. While local- fixed line were the highest number , the fingure for mobiles were lowest .
From 1995 to 1998, people in UK used most local- fixed line about 70 to 90 billions minutes and a half number of people spent for national and international fixed line. In contrast , around 30 to 45 billions mintues that people spent on mobiles phone.
From 1999 to 2002, the amount of number people used local fixed line witnessed a drammatical rise from 90 to 70 billions minutes. Nevertheless, national and international – fixed line increased considerably up to 60 billions minutes.Besides, the figure for mobiles rose to 45 billions minutes.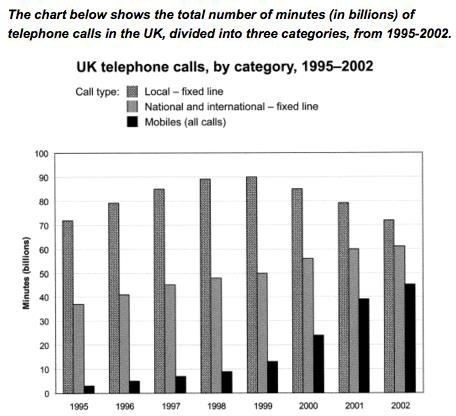
Top answer
The bar chart illustrates the changes that occurred between 1995 and 2002 in the number of three types of calls in the UK: local – fixed lin e, national and international – fixed line and mobil e . in terms of how many mintutes (in billions) did the UK use between 1995 and 2002. Overall, it is clear that the three kinds of telephone calls in the UK saw a significant rise over the seven -y ear period.
- The bar chart illustrates the changes that occurred between 1995 and 2002 in the number of three types of calls in the UK: local – fixed lin e, national and international – fixed line and mobil e .
- in terms of how many mintutes (in billions) did the UK use between 1995 and 2002.
- Overall, it is clear that the three kinds of telephone calls in the UK saw a significant rise over the seven -y ear period.
- While loca l fixe d-l ine calls were the most predominant, highest number , the f ig ure s for mobil e calls were the lowest throughout that period .
- From 1995 to 199 9 , people in the UK used most local- fixed line spent about 70 to 90 billio n minutes making local fixed-line calls, and a while about half number of people that time was spent on for national and international fixe d-l ine phone calls .
Get the Weekly English Kit 📬
New words, one handy idiom, and a 2-minute quiz — delivered to your inbox to keep your streak alive.
The bar chart illustrates the changes that occurred between 1995 and 2002 in the number of three types of calls in the UK: local – fixed line, national and international – fixed line and mobile. in terms of how many min
 Related Questions