
Cambridge IELTS 15 writing test 2 task 1 help please!!
Please help me with my writing.
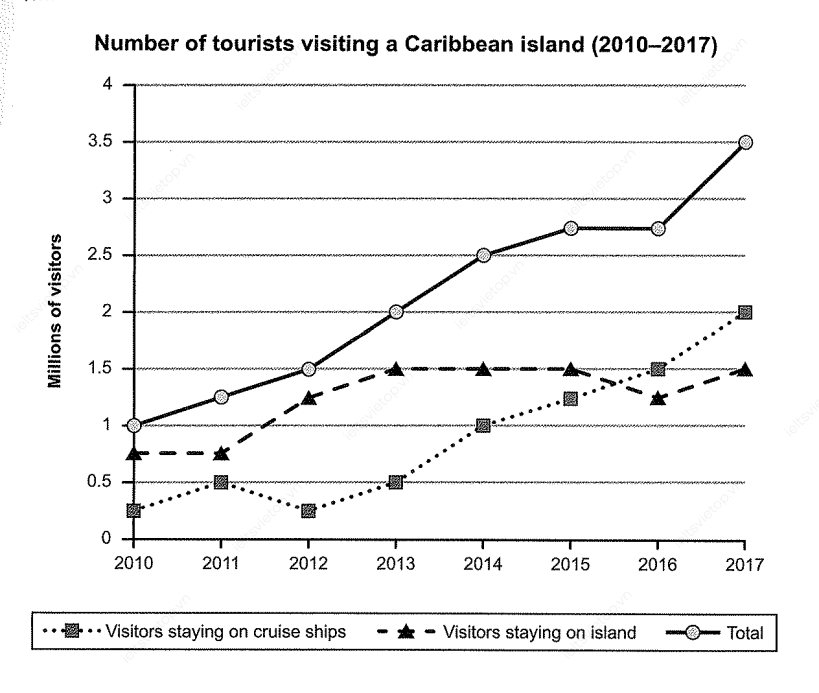
The graph below shows the number of tourists visiting a particular Caribbean island between 1010 and 2017.
Summarize the information by selecting and reporting the main features, and make comparisons where relevant.
HERE'S MY WRITING:
The chart given provides information about the number of visitors to an island of Caribbean from 2010 to 2017.
As can be seen from the graph, the total number of people visiting the island increased in the whole 7-year period, especially in the last one. Overall, staying on the island was preferable to staying on cruise ships.
Starting from about 250000, the visitor numbers who lived on cruise ships rose gradually to 500000 in 2011 before dropping back to the starting point in the next year. Then, from 2012, it made a steady recover and continued to grow till the rest years of the period with a pass over the data of guests living on the island in the middle of 2015 (1,3 millions) and hit the peak of 2 millions in 2017.
Coming to the travellers' number staying on island,the figure remained unchanged at 700000 until 2011, before increasing slowly to 1,5 millions in the next 2 year and settled down to a stable period from 2013 to 2015. However, in the last 2 years there was a marginally drop in the number of stopovers on the island, followed by a steady recovery.
(194 words)
Top answer
The line chart gives information about how many tourists visiting a particular Caribbean island over a 7-year period beginning in 2010 and ending in 2017. Overall, the most striking feature of the graph is that, in terms of the number of visitors who stayed on cruise ships and staying on island, they increased gradually in this period. It should also be noted that the total number of visitors improved.
- The line chart gives information about how many tourists visiting a particular Caribbean island over a 7-year period beginning in 2010 and ending in 2017.
- Overall, the most striking feature of the graph is that, in terms of the number of visitors who stayed on cruise ships and staying on island, they increased gradually in this period.
- It should also be noted that the total number of visitors improved.
- 5 M in 2011, after increasing it went down hit a low in 2012.
- 3 M in 2012, whereas had risen to 2 M by 2017.
Get the Weekly English Kit 📬
New words, one handy idiom, and a 2-minute quiz — delivered to your inbox to keep your streak alive.
The line chart gives information about how many tourists visiting a particular Caribbean island over a 7-year period beginning in 2010 and ending in 2017.
Overall, the most striking feature of the graph is that, in terms of the number of visitors who stayed on cruise ships and staying on island, they increased gradually in this period. It should also be noted that the total number of vis
 Related Questions