
Cambridge 15 test 2 writing task 1 help me please
Please help me check my writing.
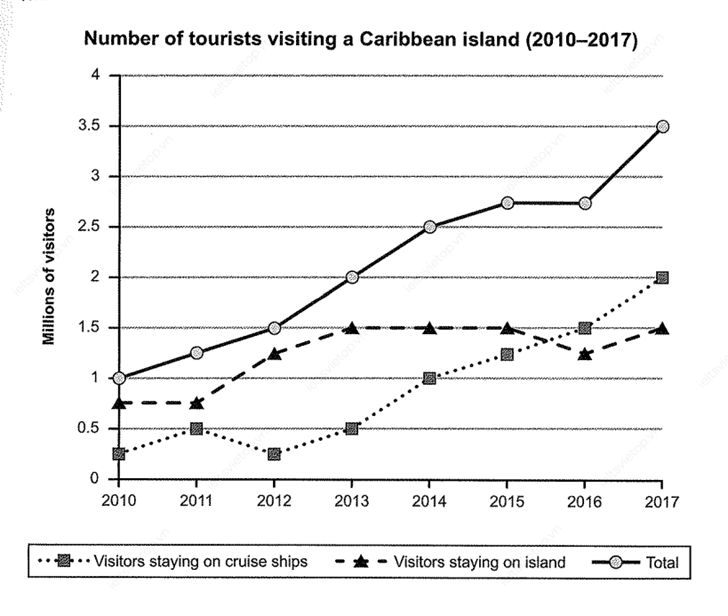
The graph below shows the number of tourists visiting a particular Caribbean island between 2010 and 2017.
Summarize the information by selecting and reporting the main features, and make comparisons where relevant.
HERE'S MY WRITING:
The chart given provides information about the number of visitors to an island of Caribbean from 2010 to 2017.
As can be seen from the graph, the total number of people visiting the island increased in the whole 7-year period, especially in the last one. Overall, staying on the island was preferable to staying on cruise ships.
Starting from about 250000, the visitor numbers who lived on cruise ships rose gradually to 500000 in 2011 before dropping back to the starting point in the next year. Then, from 2012, it made a steady recover and continued to grow till the rest years of the period with a pass over the data of guests living on the island in the middle of 2015 (1,3 millions) and hit the peak of 2 millions in 2017.
Coming to the travelers' number staying on island, the figure remained unchanged at 700000 until 2011, before increasing slowly to 1,5 millions in the next 2 year and settled down to a stable period from 2013 to 2015. However, in the last 2 years there was a marginally drop in the number of stopovers on the island, followed by a steady recovery.
(194 words)
Top answer
Please read my advice for Task 1 essays: IELTS TASK 1: Hints, Tips And Advice Vocabulary Words For Task 1: Reference Post
- Please read my advice for Task 1 essays: IELTS TASK 1: Hints, Tips And Advice Vocabulary Words For Task 1: Reference Post
Get the Weekly English Kit 📬
New words, one handy idiom, and a 2-minute quiz — delivered to your inbox to keep your streak alive.
The chart (Read my advice for the correct names of the figures.) given provides information about (That is vague and imprecise. Exactly what is plotted? How many curves are there? Read my advice) the number of visitors to an island of
Sample essay: (~190 words)
The line graph gives the numbers of vacationers to a Caribbean island from 2010 to 2017. Three curves are plotted; those who stayed on the island, those who stayed on a cruise ship, and the total number.
Overall, the visitor count steadily rose but with one pause in 2015-16. Most of that increase was due to cruise ship passengers. Th
 Related Questions