
Birth rate in China and USA
WRITING TASK 1
You should spend about 20 minutes on this task.
The graph below compares changes in the birth rates of China and the USA between 1920 and 2000.
Summarise the information by selecting and reporting the main features, and make comparisons where relevant.
Write at least 150 words
Birth Rates in China and the USA
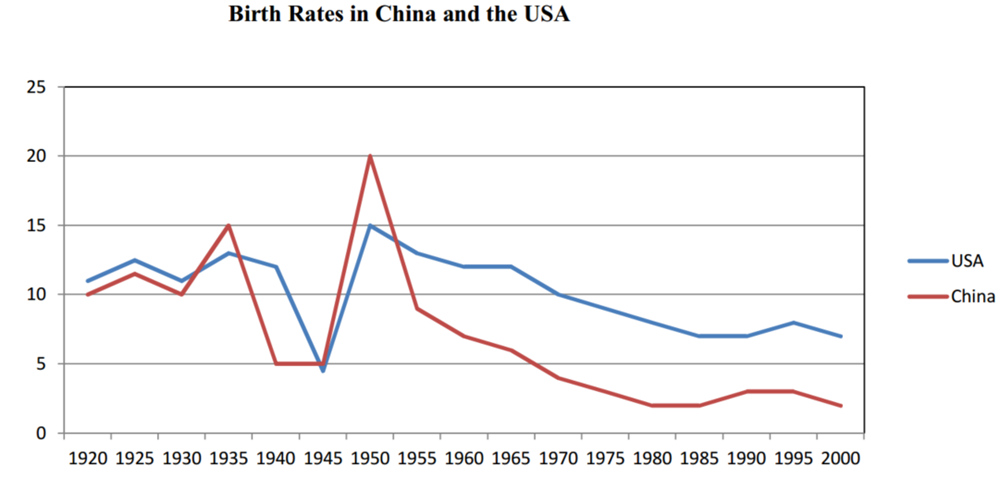
The line graph illustrates the percentage of children’s birthday in China and USA from 1920 to 2000.
In general there were significant changes in birth rates of two countries, and the most changes was seen in China. It is clear that the number of births in two countries decreased over a period 80 years and two countries reached the highest point in 1950.
In 1920, around 10% of number people in USA and China gave birth. The birth rates in USA and China fluctuated from 1920 to 1950, and the figures of China and USA reached lowest point abound 5%, China and USA peaked to over 20% and 15% respectively in 1950.
From 1950 to 2000, The were sharply decrease in the proportion of baby born in USA and China. It was noticeable the China’s figure went down under 4%, and fluctuated from 1980 to 2000. While Number of baby was born in USA remained under 7% from 1980 to 2000.
Top answer
You did a good job of extracting the information from the chart. Below you will see your writing with some corrections I have made for you. Be careful to use articles (a, an, the) when necessary.
- You did a good job of extracting the information from the chart.
- Below you will see your writing with some corrections I have made for you.
- Be careful to use articles (a, an, the) when necessary.
- Watch you subject/verb relationships.
- The line graph illustrates the percentage of children’s birthdays in China and the USA from 1920 to 2000.
Get the Weekly English Kit 📬
New words, one handy idiom, and a 2-minute quiz — delivered to your inbox to keep your streak alive.
You did a good job of extracting the information from the chart. Below you will see your writing with some corrections I have made for you. Be careful to use articles (a, an, the) when necessary. Watch you subject/verb relationships.
The line graph illustrates the percentage of children’s birthdays in China and the USA from 1920 to 2000.
In general, there were significant changes i
 Related Questions