
0
Bbser Posted 16 years ago
Vocabulary
Better graph description (just one sentence)
There was this instruction associated with the graphs below:
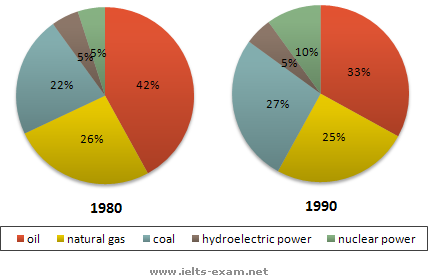
The two graphs show the main sources of energy in the USA in the 1980s and the 1990s.
But I feel this instruction is not accurate, I am seeking a more precise description of the graphs:
1) First of all, what the graphs actually show us is the percentages or proportions for the main sources of energy.
2) Secondly, the graphs are only about the years 1980 and 1990, not 1980s or 1990s; the latters mean decades starting with 1980 or 1990. Right?
So, I am thinking about this modification:
The two graphs show percentages of the main sources of energy (consumed?) in the USA in both 1980 and 1990.
Could you help and come up with a better one? Feel free to make comments. All I need is to be precise and sound normal.
Thanks a lot.
Top answer
Hi, There was this instruction associated with the graphs below: The two graphs show the main sources of energy in the USA in the 1980s and the 1990s. But I feel this instruction is not accurate, I am seeking a more precise description of the graphs: 1) First of all, what the graphs actually show us is the percentages or proportions for the main sources of energy. 2) Secondly, the graphs are only about the years 1980 and 1990, not 1980s or 1990s; the latters mean decades starting with 1980 or 1990.
- Hi, There was this instruction associated with the graphs below: The two graphs show the main sources of energy in the USA in the 1980s and the 1990s.
- But I feel this instruction is not accurate, I am seeking a more precise description of the graphs: 1) First of all, what the graphs actually show us is the percentages or proportions for the main sources of energy.
- 2) Secondly, the graphs are only about the years 1980 and 1990, not 1980s or 1990s; the latters mean decades starting with 1980 or 1990.
- Right?
- Right.
Get the Weekly English Kit 📬
New words, one handy idiom, and a 2-minute quiz — delivered to your inbox to keep your streak alive.
2 Answers
0
Hi,
There was this instruction associated with the graphs below:
The two graphs show the main sources of energy in the USA in the 1980s and the 1990s.
But I feel this instruction is not accurate, I am seeking a more precise description of the graphs:
1) First of all, what the graphs actually show us is the percentages or proportions for the main sources of energy.
0
The two graphs show that oil was the major energy source in the USA in both 1980 and 1990 and that coal, natural gas and hydroelectric power remained in much the same proportions. On the other hand, there was a dramatic rise in nuclear power, which doubled its percentage over the ten years.
Oil supplied the largest percentage of energy, although the percentage decreased from 42% in 1980
Oil supplied the largest percentage of energy, although the percentage decreased from 42% in 1980
 Related Questions