
Based on the band descriptors of IELTS Writing Task 1, please examine my essay and reveal my scores and mistakes. Plus, please correct my essays to the level of band 6.5 - 7.0.
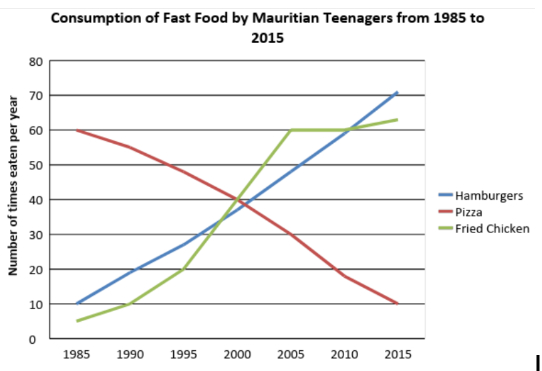
The graph depicts the consumption of three kinds of fast food by youngsters over a period of 31 years from 1985 to 2015.
Overall, it is apparent that while fried chicken and hamburgers consumption exhibited an increasing trend throughout the years, pizza consumption showed a contrasting pattern.
Looking first at the consumption of hamburgers, there was only 10 times eaten at the beginning of 1985, followed by a significant increase over the years and reached a peak of 70 times consumed by 2015. Meanwhile, fried chicken started at its lowest point, which was about 5 times used in 1985 then hit a high of 60 times after surpassing the rate of hamburgers usage.
By contrast, pizzas consumption had the highest category in half of the period, but by 2000, it was overtaken by that of hamburgers and fried chicken. The figure kept witnessing a sharp fall onwards and hit the bottom of 10 times eaten by 2015.
Get the Weekly English Kit 📬
New words, one handy idiom, and a 2-minute quiz — delivered to your inbox to keep your streak alive.
 Related Questions