
BAR CHART - WRITING TASK 1- IELTS
I could really use some assistance from you guys for my work.
Here is my answer:
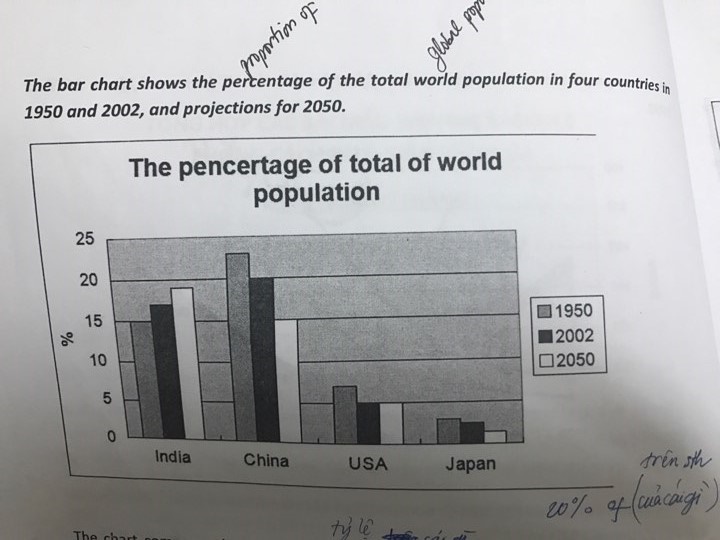
The chart compares the proportion of global population in four nations in 1950 and 2002, as well as showing projections for 2050.
It is clear that the percentage of Japan's population is by far lowest during the research period. In addition, the figure for India increases, while those for China, the USA, and Japan experience declines.
In 1950, China was the most populous country, accounting for about 23% of the world population, 8% higher than the figure for India, the second most populous one. In 2002, China saw a decrease to roughly 20% in its percentage of global population, whereas the figure for India rose slightly to approximately 17%. In 2050, it is predicted that India will become the most populated country, comprising nearly 20% of total world population and that the share of China's popuation will decline to only 15%.
Regarding the USA and Japan, the proportions of their popuation in 1950 were by far lower, at about 3% and 7% respectively. In 2002, the percentage of the USA's population fell slightly to just 5% and is projected to remain stable in 2050. The figure for Japan dropped gradually and is predicted to stand at a mere 2%.
(199 words)
Top answer
The chart compares the proportion of global population (That is not good English) in four nations in 1950 and 2002, as well as showing projections for 2050. ) It is clear that the percentage of Japan's population (Wrong expression. You are taking some part of Japan's total population.
- The chart compares the proportion of global population (That is not good English) in four nations in 1950 and 2002, as well as showing projections for 2050.
- ) It is clear that the percentage of Japan's population (Wrong expression.
- You are taking some part of Japan's total population.
- For example, "The percentage of Japan's population that was in the over-age-65 category is the highest in the world.
- ) is by far lowest during the research period.
Get the Weekly English Kit 📬
New words, one handy idiom, and a 2-minute quiz — delivered to your inbox to keep your streak alive.
The chart compares the proportion of global population (That is not good English) in four nations in 1950 and 2002, as well as showing projections for 2050. (Here is an alternative: The populations of five nations as a proportion of total world population.)
It is clear that the percentage of Japan's population (Wrong
 Related Questions