
Bar Chart - Task 1 Practice - 19t/Jun/018 -- Thanks in Advance :)
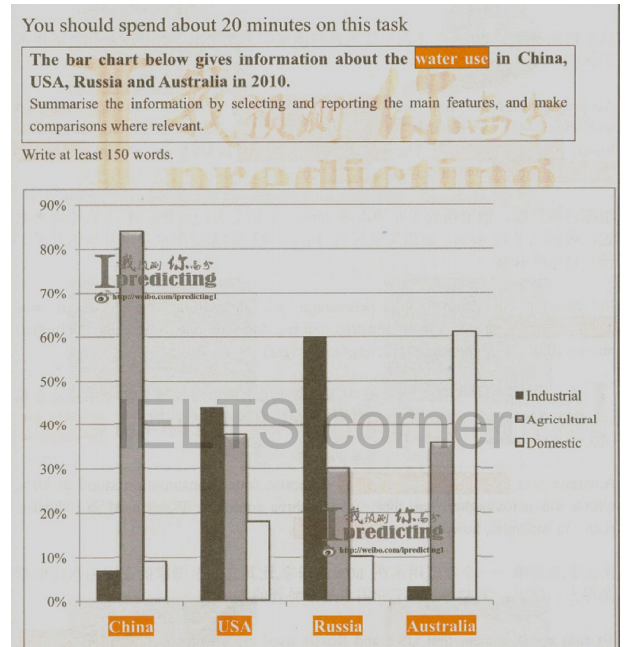
The bar chart shows the comparative percentage of water consumed for three different purposes, namely industry, agriculture and household in China, the USA, Russia and Australia in 2010.
Overall, It is clear that the level of water usage for agriculture was highest in China, while that for industrial and domestic purposes was the most in Russia and Australia respectively.
In China, the portion of water consumption for agricultural purposes stood at almost 85% (the highest level), compared to merely 30% of that in Russia (the lowest level). Moreover, while the highest percentages of water use for Industry and household were nearly the same as 60% in Russia and Australia, the lowest proportions of them stood at nearly 3% and 10% in Australia and China respectively.
In the USA, the level of difference amongst the three categories was not much, with the portions of water use for industry, agriculture and household standing at nearly 44%, 38% and 18% respectively.
Top answer
The bar chart shows the comparative percentage of water consumed for three different purposes, namely industry, agriculture and household in China, the USA, Russia and Australia in 2010. Overall, It is clear that (Only describe the data, don't write any opinions in Task 1. ) the level of water usage for agriculture was highest in China, while that for industrial and domestic purposes was the most in Russia and Australia respectively.
- The bar chart shows the comparative percentage of water consumed for three different purposes, namely industry, agriculture and household in China, the USA, Russia and Australia in 2010.
- Overall, It is clear that (Only describe the data, don't write any opinions in Task 1.
- ) the level of water usage for agriculture was highest in China, while that for industrial and domestic purposes was the most in Russia and Australia respectively.
- In China, the portion of water consumption for agricultural purposes stood at almost 85% (the highest level), compared to merely 30% of that in Russia (the lowest level).
- Moreover, while the highest percentages of water use for Industry and household were nearly the same as (60% ) in Russia and Australia, the lowest proportions of them stood at nearly were 3% and 10% in Australia and China respectively.
Get the Weekly English Kit 📬
New words, one handy idiom, and a 2-minute quiz — delivered to your inbox to keep your streak alive.
The bar chart shows the comparative percentage of water consumed for three different purposes, namely industry, agriculture and household in China, the USA, Russia and Australia in 2010.
Overall, It is clear that (Only describe the data, don't write any opinions in Task 1. ) the level of water usage for agriculture was highest in China, while that for industrial and dom
 Related Questions