
Bar chart 1
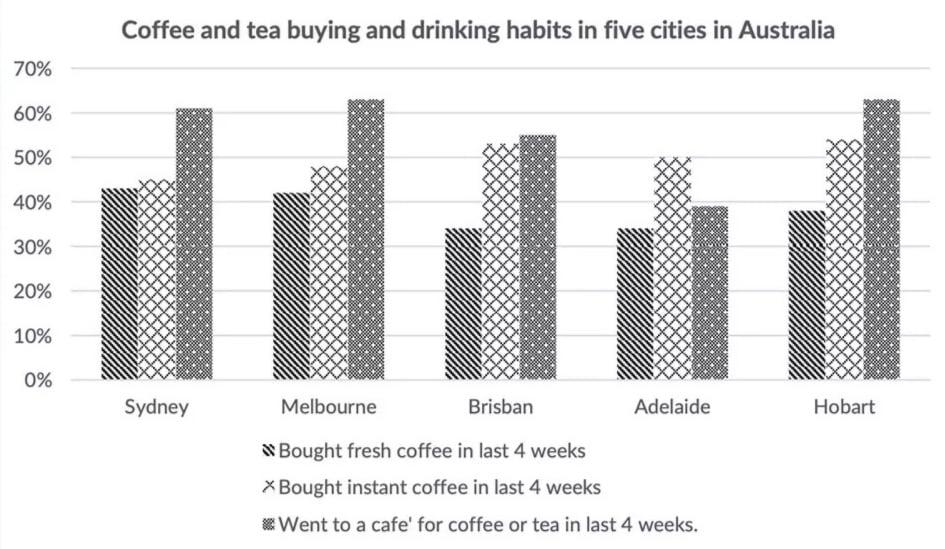
The chart below shows the results of a survey about people’s coffee and tea buying and drinking habits in five Australian cities.
Summarize the information by selecting and reporting the main features, and make comparisons where relevant.
The bar chart compares the habits of Australians in buying and drinking coffee and tea in five major cities.
It is clear that the number of Australian people in these cities who went to a cafe shop for coffee or tea drinking in the last four weeks is the highest. In contrast, the figures for people who bought fresh coffee at the same time are much lower.
Melbourne and Hobart have the same figures, also the highest in the chart, for people having coffee or tea at a cafe, at around 63%. People in Hobart also love to buy instant coffee, since the result is nearly 54%, higher than those for four other cities. Sydney has the highest percentage of people who bought fresh coffee in the last four weeks.
By contrast, Adelaide has the lowest figures in all three categories. As the figures show, the numbers of people buying fresh coffee in Brisban and Adelaide are the lowest, compared to other categories, at about 34%. Sydney and Melbourne, while having the greatest results for fresh coffee and in-café coffee consumption, have the least figures for instant coffee buying, just 45% and 48% respectively.
Top answer
Please read my advice for Task 1 essays: IELTS TASK 1: Hints, Tips And Advice Vocabulary Words For Task 1: Reference Post
- Please read my advice for Task 1 essays: IELTS TASK 1: Hints, Tips And Advice Vocabulary Words For Task 1: Reference Post
Get the Weekly English Kit 📬
New words, one handy idiom, and a 2-minute quiz — delivered to your inbox to keep your streak alive.
Please read my advice for Task 1 essays:
The bar chart compares the habits of Australians in buying and drinking coffee and tea in five major cities. (This is inadequate. What is plotted on the chart? What are the five cities? How can habits be plotted numerically? What are the units of measure?)
It is clear that (Read my advice) the number (A number i
 Related Questions