
Another writing task 1 essay
I really need someone who can check my essay. Thank you so much.
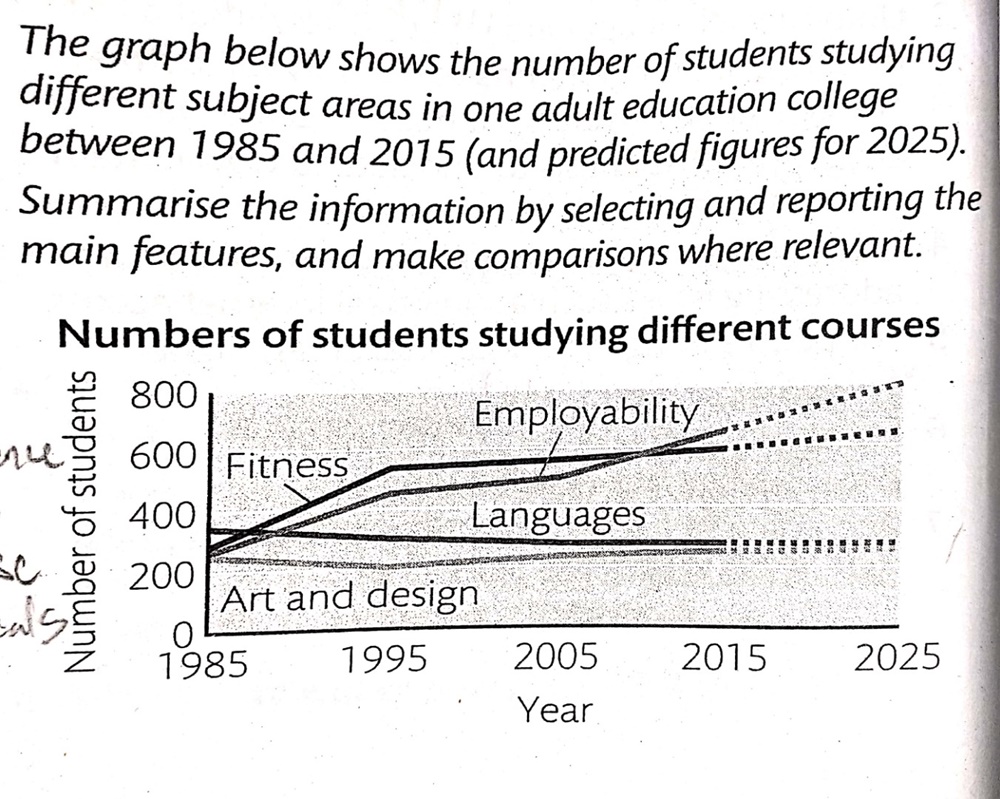
- The line graph shows significant variation in the number of students on different courses in one adult education college over 30 years, including the predicted figures for 2025. The information shows that for almost each year, fitness and employability courses are more commonly chosen by students, while languages and art design courses are declined over the period.
From 1985 to 1995, the number of students studying different subjects area were changed significantly. In 1985, appoximately 400 students choose to learn languages, and it was the most popular field at that time. In the same year, other courses are fitness, employability and art and design were just selecited by 200 students, only a half compared to languages course. In fact, the figure representing fitness and employability areas steadily climbed after five years and became two most popular choices for students, while languages, which were the highest in 1985, declined dramatically until 1995.
Thirty years later, most of the number representing subject areas were constant, except employability course. The figure for students studying this course had rose gradually for ten years, from 2007 to 2015. In addtition, employability field is predicted to be the most common choice for students in 2025.
In short, it can clearly be seen that differences in number of students studying different subjects have become more pronounced relative to years.
Top answer
The line graph shows significant variation in t he number of students on in/taking different courses in one adult education college over 30 years, including the predicted figures for out to 2025. The information graph shows that for almost each year, fitness and employability courses are more commonly chosen by students, while languages and ar t- and- d esign courses are declined follow a mostly flat trend over the period. From 1985 to 1995, the number of students studying different subjects area were changed significantly .
- The line graph shows significant variation in t he number of students on in/taking different courses in one adult education college over 30 years, including the predicted figures for out to 2025.
- The information graph shows that for almost each year, fitness and employability courses are more commonly chosen by students, while languages and ar t- and- d esign courses are declined follow a mostly flat trend over the period.
- From 1985 to 1995, the number of students studying different subjects area were changed significantly .
- [ Avoid meaningless generic waffle like this] In 1985, app r oximately 400 students choose chose to learn languages, and it was the most popular field at that time.
- In the same year, other courses are in fitness, employability and art and design were just [ 1] selecited selected by just over 200 student s.
Get the Weekly English Kit 📬
New words, one handy idiom, and a 2-minute quiz — delivered to your inbox to keep your streak alive.
The line graph shows significant variation in the number of students on in/taking different courses in one adult education college over 30 years, including the predicted figures for out to 2025. The information
 Related Questions