
A report in IELTS task 1
The chart shows the actual and estimated numberas of visitors to a new art gallery from 1990 to 2001. Results in satisfaction rating of visitors in 1990 and 2001 to the gallery were also indicated.
Overall, actual numbers always exceeded those in estimated and despite the expectation of changing gradually, actual numbers showed sharp fluctuation every year.
In 1990, estimated number was under 500 thousands while actual number was approximately 1500 thousands, which was greater than 200%. After experiencing erractic fluctuation during 8 years, actual numbers went up in equal steps from 1998 and reached to its peak in 2001.
Numbers of visitors were influenced by three events over the period. The sack of the director made a decrease of visitors in 1992 to under 2 millions while previous years number was approximately 2.25 millions. In 1994, the number dropped to its level in 1990. By the same time, a new shop opened and the number reached to nearly 2.5 millions in 1995. in 1995, new director appointed created higher numbers for the following years, reached to almost 3 millions. The number then declined steadily and went up again from 1998.
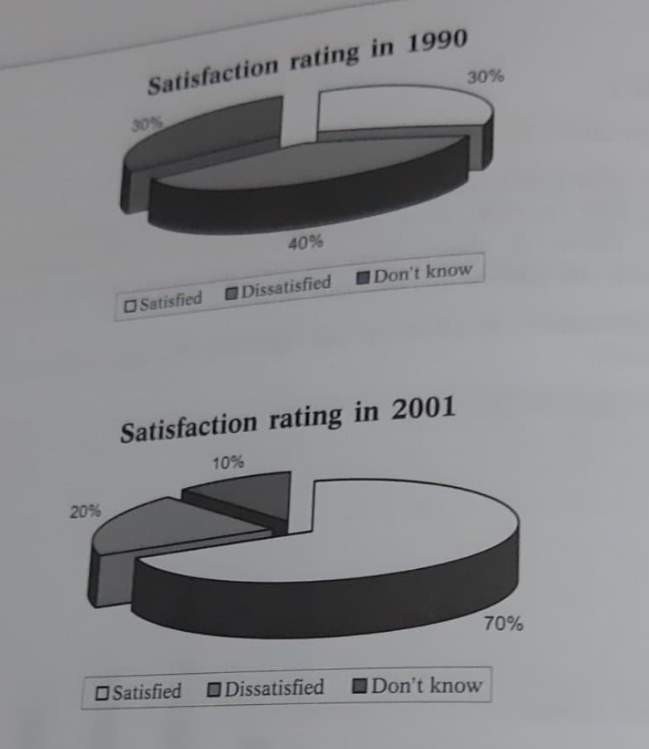
The satisfied rating in 2001 was marked as 70%, higher than it was in 1990 with 30% only. Consequently. disatisfied percent decreased sharply to 10% while it was up to 40% in 1990. 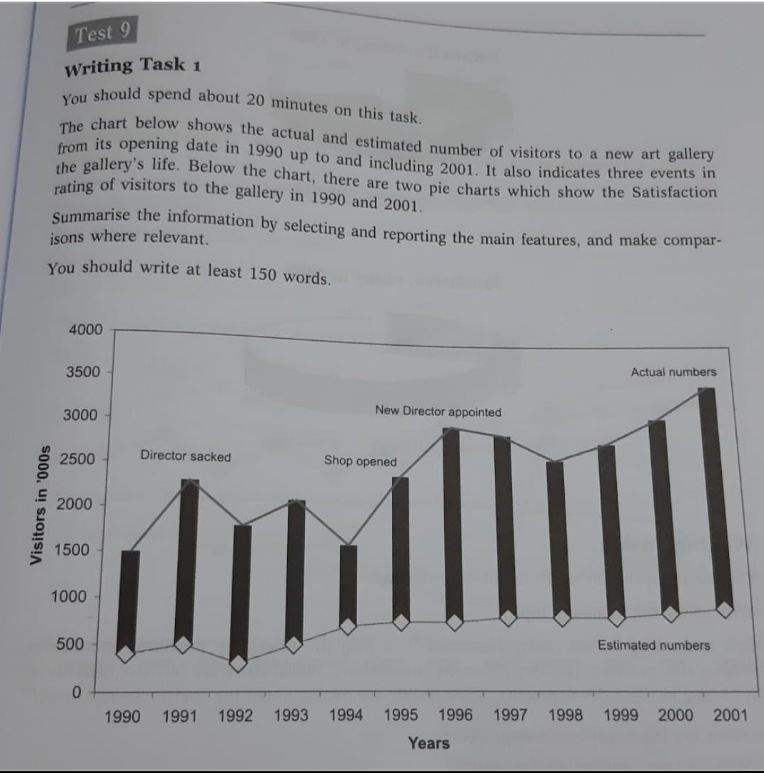
Get the Weekly English Kit 📬
New words, one handy idiom, and a 2-minute quiz — delivered to your inbox to keep your streak alive.
 Related Questions