
A report in IELTS task 1
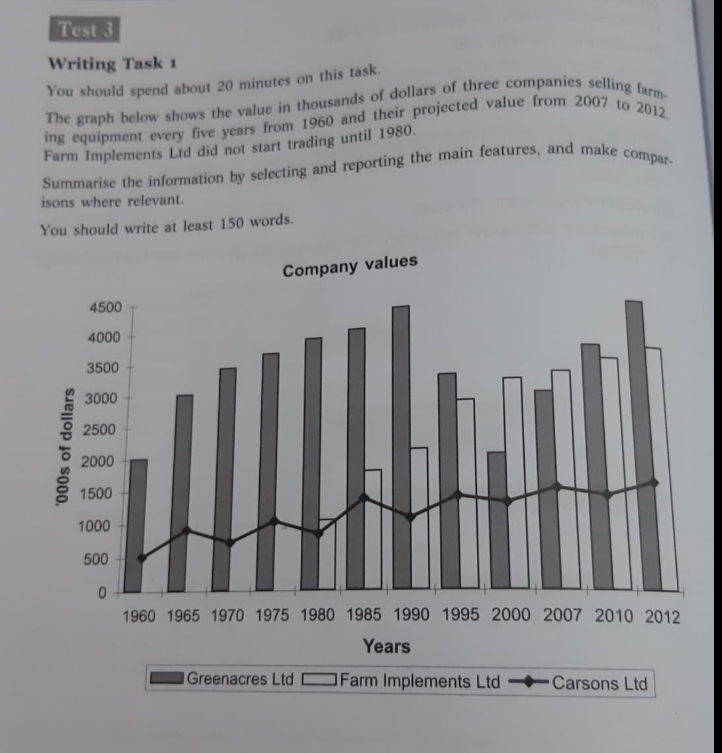
The graph indicates the value in thousands of dollars of three selling farming euipment, namely Farm Implements Ltd, Carson Ltd and Greenacres Ltd, every five years from 1960 and their projected value from 2007 to 2012.
The value of three companies has different pattern over years. It is noticeable that Farm Implements Ltd income started in 1980 while other's value has been marked 20 years before. However, it went on an upward trend while Carson Ltd and Greenacres Ltd fluctuated through years.
Greenacres Ltd value growed gradually during the first 30 years, rising 100% from 2000 dollars in 1960 to 4000 dollars in 1990. After declining significantly in the next two years. Greenacres Ltd went up again in the following years. On the other hand, Carson Ltd fluctuated every marked years over the period. Meanwhile, it rose from 500 dollars in 1960 to approximately 1500 dollars in 2012, which is more than 200%.
Farm Implements Ltd, whose value started in the year of 1980 at the scale of nearly 1000 dollars, went up steadily. Otherwise, it was still well below Greenacres Ltd in 2012 with 3500 dollars in value.
Top answer
You need to divide this graph into two time periods, historical and projected. The verbs used in each period are different because one is actual measured data, and the other is an estimate. You need to read the units of measure on the Y-axis carefully.
- You need to divide this graph into two time periods, historical and projected.
- The verbs used in each period are different because one is actual measured data, and the other is an estimate.
- You need to read the units of measure on the Y-axis carefully.
- Please read my advice for Task 1 essays.
- Also, when you mention data values, be sure to write the correct numbers.
Get the Weekly English Kit 📬
New words, one handy idiom, and a 2-minute quiz — delivered to your inbox to keep your streak alive.
You need to divide this graph into two time periods, historical and projected. The verbs used in each period are different because one is actual measured data, and the other is an estimate.
You need to read the units of measure on the Y-axis carefully.
Please read my advice for Task 1 essays. Also, when you mention data values, be sure to write the correct numbers.
 Related Questions